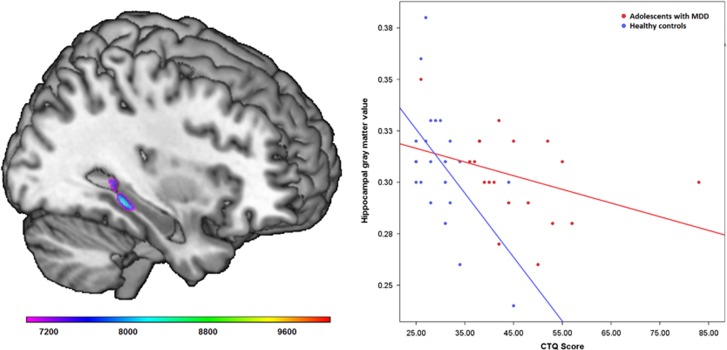
Figure 2.
Associations between brain structure, diagnosis, and childhood maltreatment. Left: coronal view (Montreal-Neurological-Institute coordinate at x=33) depicting significant gray-matter volume reductions in the bilateral hippocampal formation in adolescents with major depressive disorder compared to healthy controls (color bar: TFCE score, PFWE=0.05, k=53 voxel). Right: scatter plot depicting the association between gray-matter volume and Childhood-Trauma-Questionnaire scores for MDD patients (red) and healthy controls (blue). A full color version of this figure is available at the Neuropsychopharmacology journal online.

