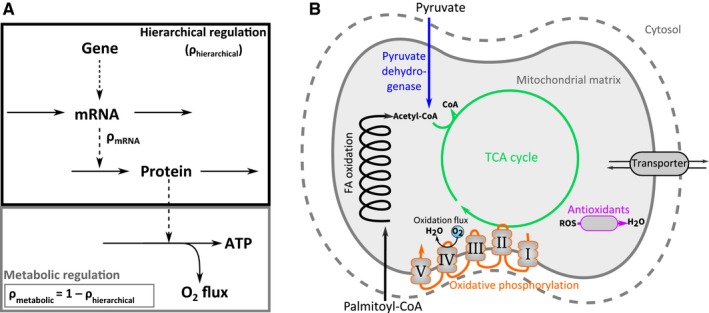
Figure 1.

Overview of Regulation Analysis and system of interest. (a) The flow of information from gene, via mRNA, to proteins and metabolic flux. Regulation coefficients are indicated in the scheme. (b) Scheme of mitochondrial substrate oxidation. Colour coding of different pathways represented here is also used in Figure 5
