
Figure 6.
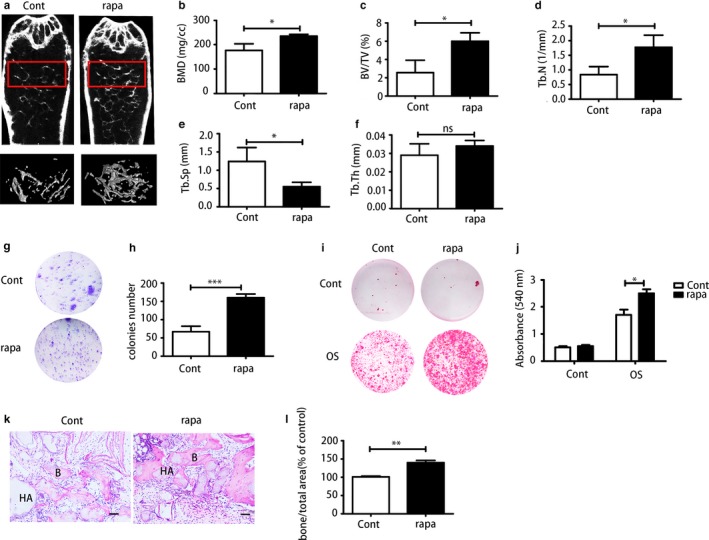
Rapamycin could restore the bone loss in aged mice. (a) Micro‐CT analysis of trabecular bone mass in the femora of the control group and rapamycin‐treated group. Quantitative analysis including (b) bone mineral density (BMD) (N = 3), (c) trabecular bone volume (BV/TV) (N = 3), (d) trabecular number (Tb.N) (N = 3), (e) trabecular space (Tb.Sp) (N = 3) and (f) trabecular thickness (Tb. Th) (N = 3). (g, h) CFU staining and quantitative analysis of bone marrow‐derived mesenchymal stem cells (BMMSCs) from both groups. (i, j) Alizarin Red staining and quantitative analysis of BMMSCs from the control group and rapamycin‐treated group. (k, l) H&E staining was used to determine BMMSCs osteogenesis capacity in nude mice. Scale bar = 100 μm. Results are presented as means ± SD. n = 3. *p < .05, **p < .01, ***p < .001