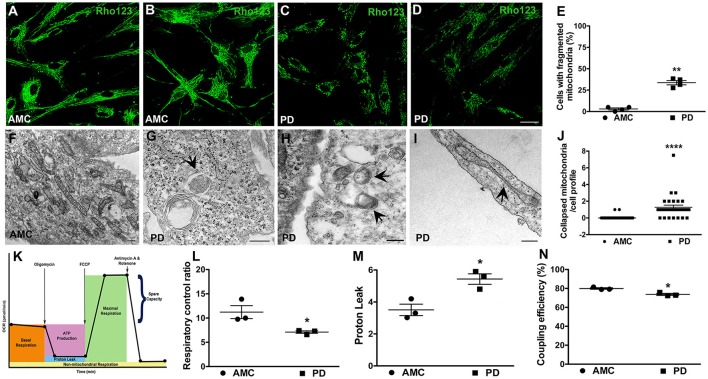
Figure 4.
Mitochondrial dysfunction in PD fibroblasts. Rhodamine 123 stained fibroblasts showing bright and typical mitochondrial network morphology in AMC cells (A,B) but low intensity fragmented mitochondria in PD fibroblasts (C,D). (B,D) are maximum intensity projection images from confocal z-stacks. Rhodamine 123 quantification is in (E). Electron micrograph displaying normal mitochondrial morphology in AMC cells is depicted in (F). PD cultures on the other hand showed abnormal features such as mitophagy (G), mitochondria lacking cristae (H), and collapsed mitochondria (I). Quantification of collapsed mitochondria is in (J). Schematic depicting the steps of the mitostress test is in (K). RCR is significantly lower on average (L), and PL is significantly higher, in PD cells (M). Relatively lower CE is seen in PD lines on average (N). Scale Bars: (A–D) = 40 μm; (F–I) = 250 nm. *p < 0.05, **p < 0.01, ****p < 0.0001; Mean ± SEM, Unpaired t-tests with Welch's correction (E) and two-way ANOVA with Tukey's post-test (L–N); Median ± interquartile range, Mann Whitney U-test (J); n = 3–4 independent PD and AMC lines.

