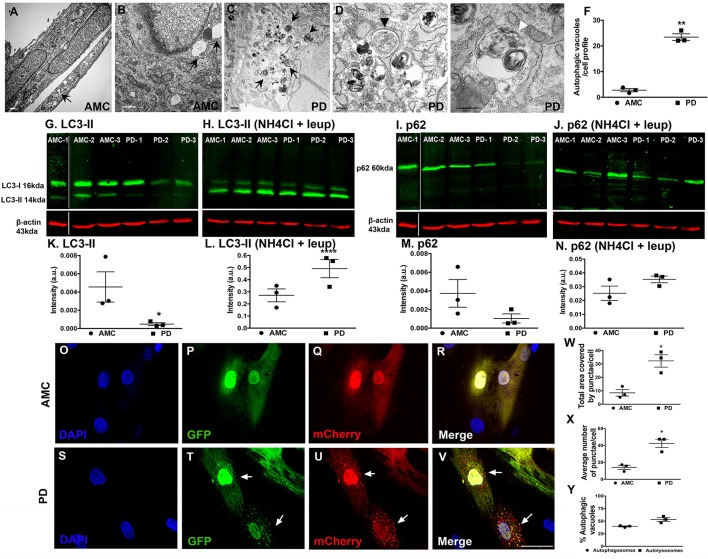
Figure 5.
Increased autophagy at baseline in PD fibroblasts. (A,B) (arrows) shows electron micrographs of AMC fibroblasts with some autophagic vesicles. However, PD fibroblasts contained significantly more autophagic vesicles (C, arrows). A classic double-membrane autophagosome with cargo (D, black arrowhead) and autolysosome with degradative material (E, white arrowhead), as seen in a PD fibroblast. (F) shows EM quantification of autovesicles. Western blots showing significantly lower protein expression of autophagy marker LC3-II in PD fibroblasts (G,K) and p62 (I,M) at baseline. Normalization occurred to ß-Actin. LC3-II and p62 expression (flux) increased upon blocking of degradation via a combination of NH4Cl and Leupeptin in especially PD cell lines (H,L,J,N). Fluorescence tracking of autophagic flux in Ad-mCherry-GFP-LC3 transfected AMC fibroblasts is shown in (O–V) with quantification in (W–Y). Green puncta represent autophagosomes whereas red puncta represent autolysosomes. Scale Bars: (A–E) = 500 nm, (O–V) = 50 μm. *p < 0.05, **p < 0.01, ****p < 0.0001; Mean ± SEM, Unpaired t-tests with Welch's correction, n = 3 independent PD and AMC lines.

