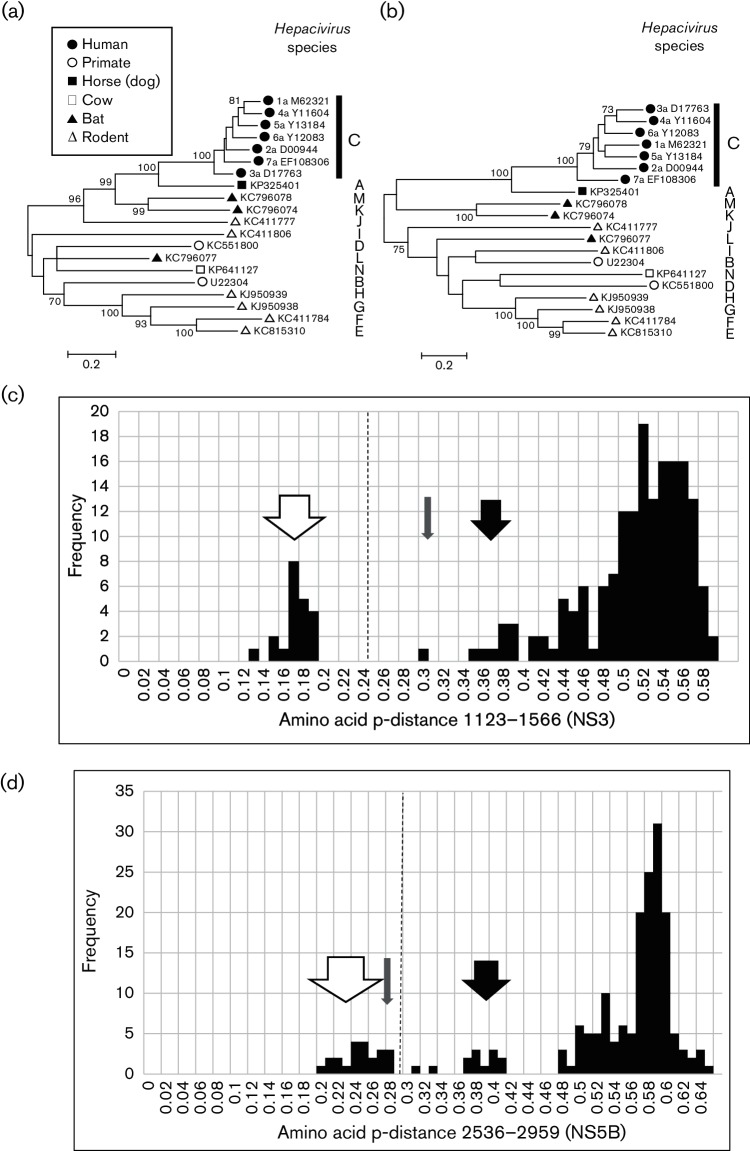
Fig. 2.
Analysis of Hepacivirus conserved regions. Maximum-likelihood trees were produced using mega6 for (a) positions 1123–1566 and (b) 2536–2959 of the virus polyprotein using the Le and Gascuel model and a gamma distribution of variation with invariant sites. Branches observed in >70 % of bootstrap replicates are indicated. Proposed Hepacivirus species assignments are indicated by single letters to the right of each branch. (c) Frequency histograms of amino acid p-distance between Hepacivirus sequences in the region 1123–1566 and (d) the region 2536–2959. The range of distances between different genotypes of Hepacivirus C (HCV) is indicated by an open arrow, between Hepacivirus G and Hepacivirus H by a shaded arrow and between Hepacivirus A and Hepacivirus C by a black arrow. The distance that demarcates different species is indicated by a dotted line.

