
Fig. 5.
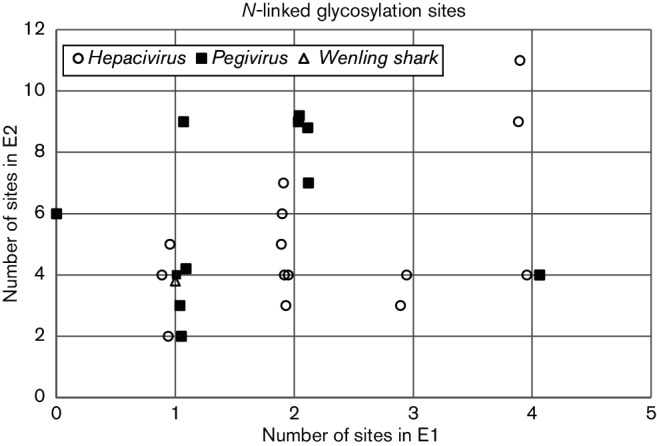
Predicted number of N-glycosylation sites. Scatter plots show the number of Asn-X-Ser/Thr glycosylation sites predicted for E1 (X-axis) or E2 (Y-axis) using NetNGlyc 1.0 Server (http://www.cbs.dtu.dk/services/NetNGlyc/) for individual species of Pegivirus (■), Hepacivirus (○) and for Wenling shark virus (∆). Points have been jittered on the X-axis to improve legibility.