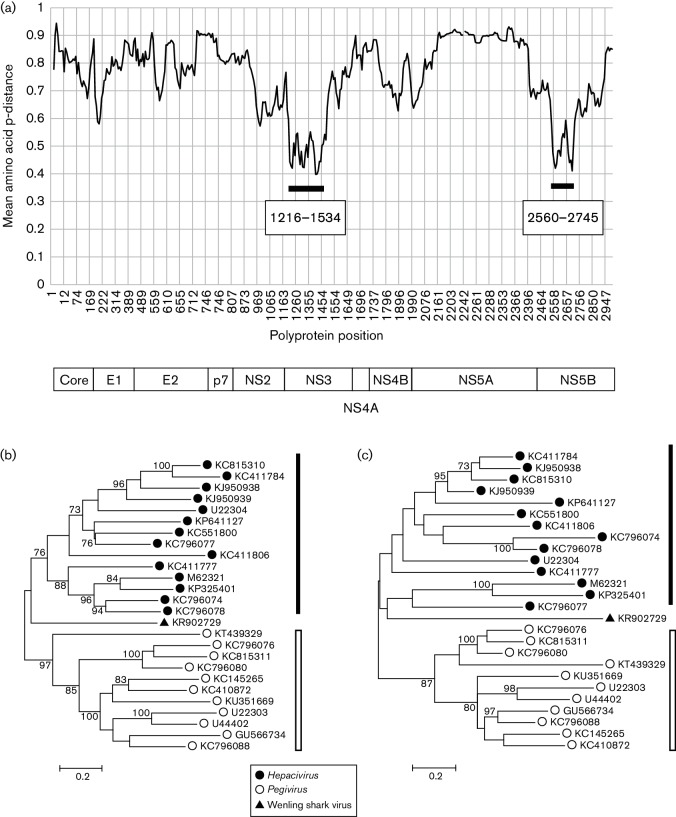
Fig. 6.
Comparative analysis of Wenling shark virus. (a) Mean amino acid p-distance across the virus polyprotein between single representatives of each Hepacivirus and Pegivirus species with Wenling shark virus was plotted against polyprotein position (numbered relative to M62321). The positions of two regions where mean p-distances were <0.6 are indicated by solid bars. A schema of the boundaries between virus proteins is given below. (b) Phylogenetic analysis of representatives of each Hepacivirus (filled circles) and Pegivirus (open circles) species was analysed together with Wenling shark virus (filled triangle) using amino acid sequences between positions (b) 1216–1534 and (c) 2560–2745. Trees were constructed from maximum-likelihood distances using a Le and Gascuel model with a gamma distribution of variation with a class of invariant sites. Branches supported by >70 % of bootstrap replicates are indicated.

