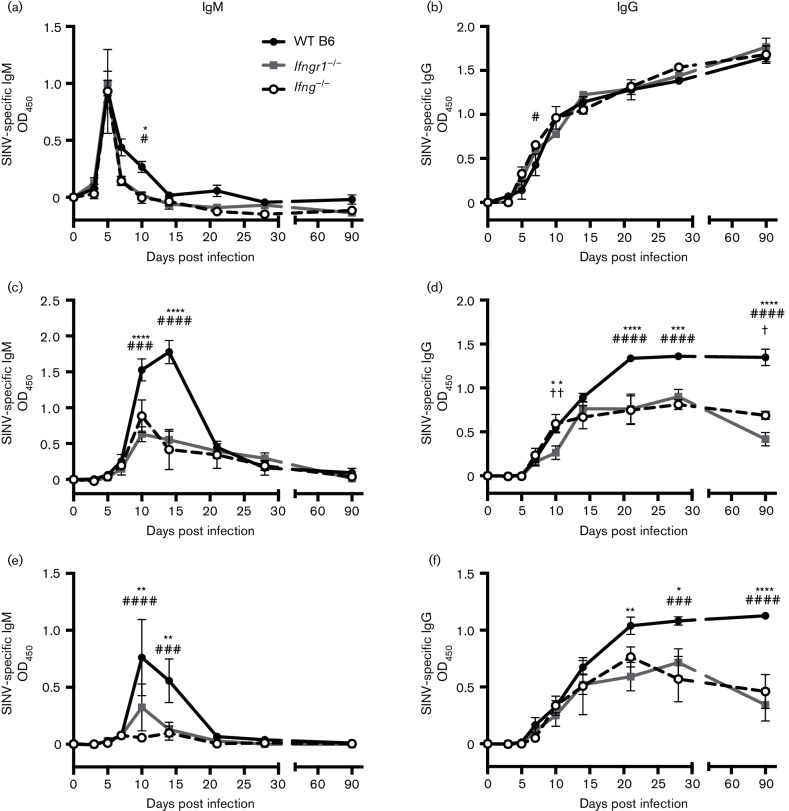
Fig. 4.
Effect of IFN-γ on SINV-specific antibody production. Anti-SINV IgM (a, c, e) and IgG (b, d, f) were measured in the serum (a, b), brains (c, d) and spinal cords (e, f) of WT B6, Ifngr1−/− and Ifng−/− mice by ELISA. Data are presented as mean ODs±sem for three to four mice per strain per time point; *P<0.05, **P<0.01, ***P<0.001, ****P<0.0001, WT B6 vs Ifngr1−/−; #P<0.05, ###P<0.001, ####P<0.0001, WT B6 vs Ifng−/−; †P<0.05, ††P<0.01, Ifngr1−/− vs Ifng−/−, Tukey’s multiple comparisons test.

