
Figure 4. Colocalization of chaperones with HttExon1Q48 aggregates in vitro and in vivo .
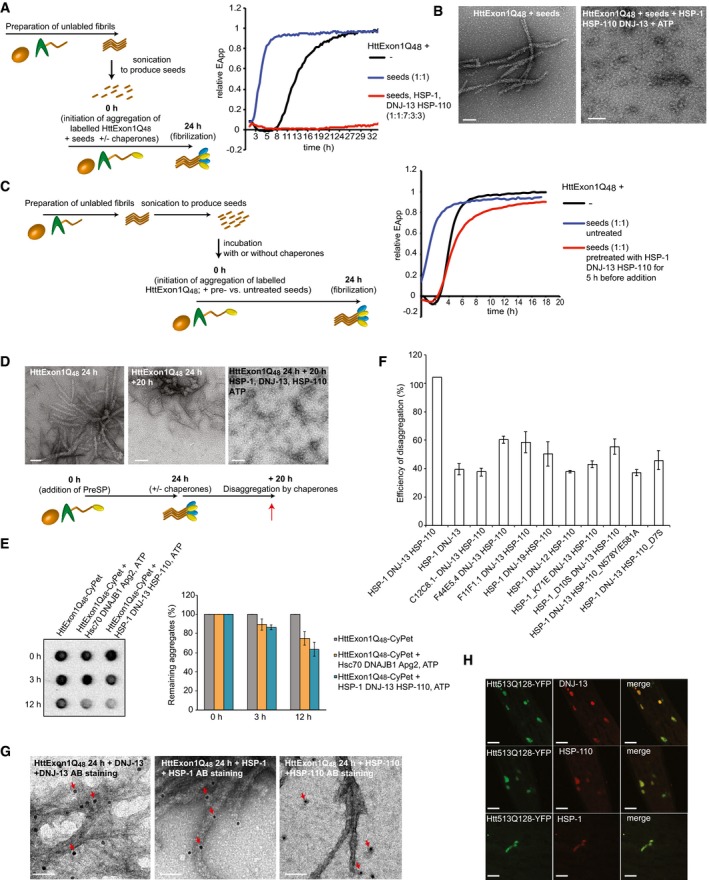
- A scheme of the experimental outline is depicted on the left. On the right, FRET assay of Htt fibrilization in the presence of Htt seeds (blue), in the presence of Htt seeds + HSP‐1, HSP‐110, and DNJ‐13 (red) and the control (black).
- TEM analysis of (A). Scale bars: 100 nm.
- A scheme of the experimental outline is depicted on the left. On the right, FRET assay of suppression of fibrilization in the presence of seeds (blue) and seeds that were incubated with the chaperones for 5 h prior to initiation of FRET assay (red). The control is depicted in black.
- TEM analysis of disaggregation of HttEx1Q48 fibrils. On the left: HttExon1Q48 fibrils 24 h post‐PreSP treatment (t = 0 h; same image as depicted in Figs 1D and G, and 2C); middle: HttExon1Q48 fibrils at t = 20 h; right: disaggregation of HttExon1Q48 fibrils by nematode chaperones (HSP‐1, HSP‐110, DNJ‐13, ATP) t = 20 h. A scheme of the experimental outline is depicted below. Scale bars: 100 nm.
- Filter retardation analysis of the disaggregation of HttExon1Q48 fibrils by human (Hsc70, DNAJB1, Apg2; middle row) and nematode chaperones (HSP‐1, DNJ‐13, HSP‐110; right row). The control (absence of chaperones) is depicted on the left. The time points of analysis are indicated on the left side. A quantification of the disaggregation reaction is depicted in the graph on the right (N = 3). All signals were normalized to the control. Error bars represent the standard deviation.
- Disaggregation analysis of HttExon1Q48 fibrils by a sedimentation analysis using the CyPet signal as readout for the moieties of the supernatant and pellet fraction. All data were normalized to the control (absence of chaperones). The chaperone mixtures that were analyzed are indicated on the x‐axis (N = 5). Error bars represent the standard deviation.
- TEM analysis of the interaction of individual chaperones with HttExon1Q48 fibrils by immunostaining. HttExon1Q48 fibrils were incubated for 1 h with the individual chaperones, and the interaction of the chaperones was analyzed by immunostaining using the respective antibodies; left: DNJ‐13, middle: HSP‐1, and right: HSP‐110. Scale bars: 50 nm. The red arrows mark the positive immunogold labeling.
- In vivo colocalization of DNJ‐13, HSP‐1, and HSP‐110 with Htt513Q128‐YFP. Htt513Q128‐YFP‐expressing nematodes were immunostained with the antibodies against DNJ‐13 (top row), HSP‐1 (middle row), and HSP‐110 (bottom row). Depicted are head regions of the nematode. Scale bars: 20 μm.