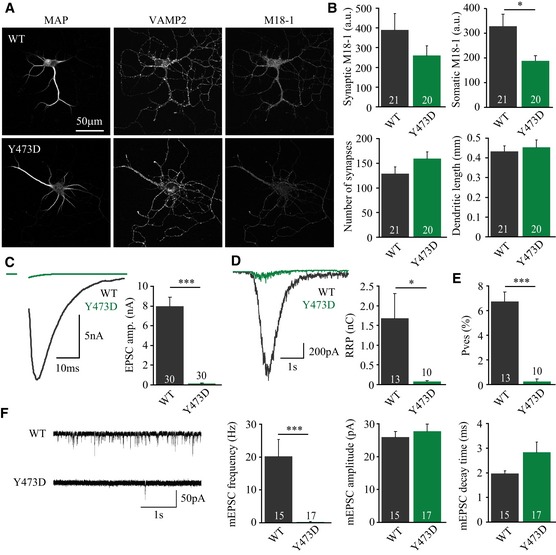
null hippocampal neurons were rescued with a phosphomimetic Munc18‐1 mutant, Y473D, or wild‐type Munc18‐1 as control and assessed on morphology and synaptic transmission using confocal microscopy (A and B) and whole‐cell patch‐clamp electrophysiology (C–G), respectively.
Typical confocal images from neurons stained for MAP2, Synaptobrevin/VAMP2, and Munc18‐1.
Average synaptic Munc18‐1 intensity (M18WT: 389 ± 85 a.u., n = 21; M18Y473D: 261 ± 49 a.u., n = 20, t‐test with Welch correction, P = 0.2000), somatic Munc18‐1 intensity (M18WT: 328 ± 49 a.u., n = 21; M18Y473D: 188 ± 21 a.u., n = 20, t‐test with Welch correction, *P = 0.0138), synapse number (M18WT: 129 ± 14, n = 21; M18Y473D: 159 ± 14, n = 20, t‐test, P = 0.1203), and dendrite length (M18WT: 0.433 ± 0.028, n = 21; M18Y473D: 0.454 ± 0.037, n = 20, t‐test, P = 0.6613).
Left: typical examples of evoked release upon action potential stimulation. Average EPSC amplitude (M18WT: 7.96 ± 0.94 nA, n = 30; M18Y473D: 0.12 ± 0.05 nA, n = 30, Mann–Whitney U‐test, ***P < 0.0001).
Left: typical responses to hyperosmotic sucrose application (500 mM, 3.5 s) used to assess the RRP. Average RRP charge (M18WT: 1.68 ± 0.64 nC, n = 13; M18Y473D: 0.08 ± 0.02 nC, n = 10, t‐test with Welch correction, *P = 0.0274).
Average P
ves (EPSC charge/RRP charge) (M18WT: 6.75 ± 0.77%, n = 13; M18Y473D: 0.24 ± 0.20%, n = 10; Mann–Whitney U‐test, ***P < 0.0001).
Left: example traces of spontaneous release of single SVs (mEPSCs). Average mEPSC frequency (M18WT: 20.18 ± 5.18 Hz, n = 15; M18Y473D: 0.28 ± 0.13 Hz, n = 17, Mann–Whitney U‐test, ***P < 0.0001), mEPSC amplitude (M18WT: 26.0 ± 1.7 pA, n = 15; M18Y473D: 27.8 ± 2.2 pA, n = 17, t‐test, P = 0.5372), and mEPSC decay time (M18WT: 1.98 ± 0.10 ms, n = 15; M18Y473D: 2.84 ± 0.41 ms, n = 17, t‐test with Welch correction, P = 0.0549).
Data information: Data are presented as mean values ± s.e.m.

