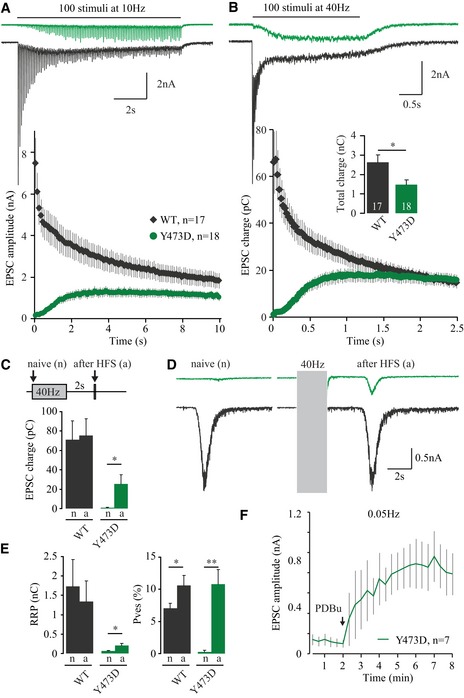
Synaptic transmission was assessed during and immediately after sustained stimulation in autaptic excitatory m
.
Rundown of EPSC amplitude during 100 pulses at 10 Hz. Top: example traces of the current evoked by 40‐Hz stimulation.
EPSC charge during 100 pulses at 40 Hz. Top: example traces of the current evoked by 40‐Hz stimulation. Insert shows total charge transferred during entire train (M18WT: 2.63 ± 0.38 nC, n = 18; M18Y473D: 1.48 ± 0.24 nC, n = 18; t‐test with Welch correction, *P = 0.0177).
Synaptic transmission was assessed before [naive (n)] and 2 s after (a) 40‐Hz stimulation. Average EPSC charge M18WT (naive: 70.9 ± 19.5 pC; after HFS: 75.4 ± 17.4 pC, n = 12, paired t‐test, P = 0.4049). Average EPSC charge M18Y473D (naive: 0.888 ± 0.342 pC, after HFS: 25.6 ± 9.3 pC, n = 9, paired t‐test, *P = 0.0271).
A hypertonic sucrose solution (500 mM, 3.5 s) was applied to release the RRP before [naive (n)] or 2 s after (a) HFS (100 pulses at 40 Hz, gray box).
Quantification of RRP and P
ves (EPSC charge/RRP charge * 100) from (C and D). Average RRP size M18WT (naive: 1.73 ± 0.69 nC, after HFS: 1.34 ± 0.54 nC, n = 12, paired t‐test, P = 0.0557). Average RRP size M18Y473D (naive: 0.061 ± 0.019 nC, after HFS: 0.207 ± 0.050 nC, n = 9, paired t‐test, *P = 0.0246). Average P
ves M18WT (naive: 7.07 ± 0.76%, after HFS: 10.6 ± 1.6%, n = 12, paired t‐test, *P = 0.0201). Average P
ves M18Y473D (naive: 0.27 ± 0.22%, after HFS: 10.8 ± 2.2%, n = 9, paired t‐test, **P = 0.0012).
PDBu application (1 μM) enhanced EPSC size in neurons expressing M18Y473D.
Data information: Data are presented as mean values ± s.e.m.

