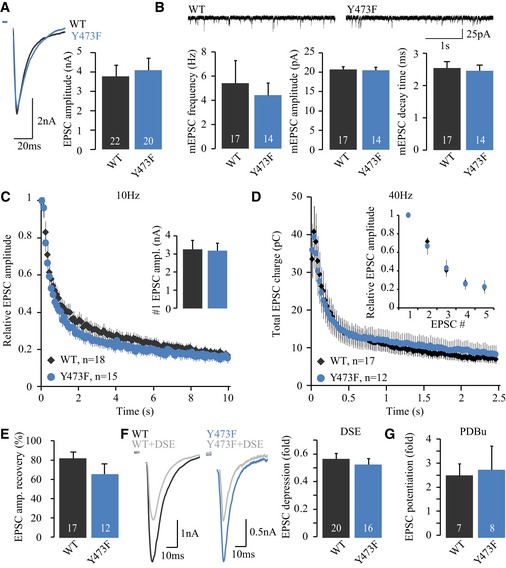
, was tested with whole‐cell patch‐clamp electrophysiology.
Evoked release upon action potential stimulation. Average EPSC amplitude (M18WT: 3.78 ± 0.58 nA, n = 22; M18Y473F: 4.10 ± 0.61 nA, n = 20, Mann–Whitney U‐test, P = 0.7915). Typical responses are depicted on the top.
Average mEPSC frequency (M18WT: 5.42 ± 1.86 Hz, n = 17; M18Y473F: 4.42 ± 1.01 Hz, n = 14, t‐test with Welch correction, P = 0.6424), mEPSC amplitude (M18WT: 20.72 ± 0.7 pA, n = 17; M18Y473F: 20.5 ± 0.9 pA, n = 14, t‐test, P = 0.8373), and mEPSC decay time (M18WT: 2.54 ± 0.20 ms, n = 17; M18Y473F: 2.46 ± 0.18 ms, n = 14, t‐test, P = 0.7550). Example traces of spontaneous release are depicted on top.
EPSC depression during 10‐Hz stimulation is normal.
Depression of EPSC charge during 40‐Hz stimulation is normal. Inset shows the first five pulses.
EPSC amplitude recovery 2 s after an RRP depleting 40‐Hz train. Average EPSC recovery (M18WT: 82.2 ± 6.7%, n = 17; M18Y473F: 65.5 ± 11.0%, n = 12, t‐test, P = 0.1805).
The amount of DSE‐triggered EPSC depression was quantified by the ratio of the average EPSC amplitude (taken over four pulses given at 0.2 Hz) before or immediately following 10‐s depolarization to 0 mV. Typical EPSCs before and following DSE induction are depicted on the left. Average DSE (M18WT: 0.57 ± 0.04 fold, n = 20; M18Y473F: 0.53 ± 0.04 fold, n = 16, t‐test, P = 0.5227).
PDBu was bath‐applied during 0.05‐Hz stimulation. Maximum potentiation of EPSC amplitude (M18WT: 2.56 ± 0.48 fold, n = 7; M18Y473F: 2.82 ± 0.98 fold, n = 8, t‐test with Welch correction, P = 0.8168).
Data information: All error bars are s.e.m.

