
Figure 2.
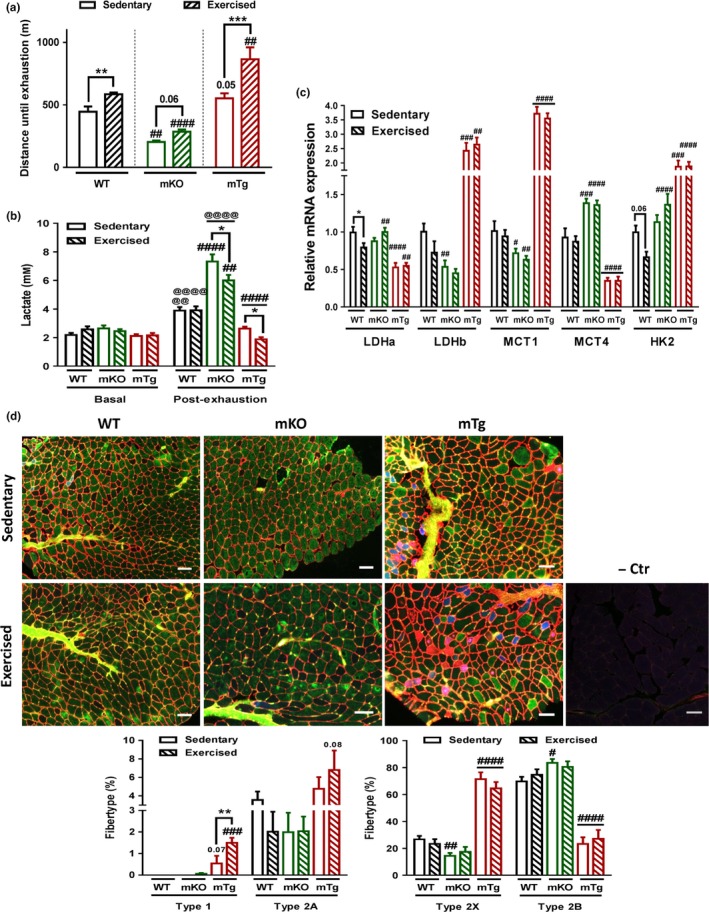
PGC‐1α potentiates exercise‐dependent endurance increase (a) Endurance level of mice challenged on a treadmill (n = 8–10). (b) Pre and postexercise blood lactate levels (n = 8–10). (c) Relative quadriceps mRNA levels of genes involved in lactate regulation and glycolysis (n = 4–6). (d) Representative pictures and quantification of fiber type staining of tibialis anterior muscles (red = type 1 fibers and cell membranes; blue = type 2A fibers; green = type 2B fibers; black = type 2X fibers). Scale bars represent 100 μm (n = 4–6). Values are mean ± SEM. *p < .05; **p < .01; ***p < .001; indicate statistically significant differences between sedentary and exercised animals of the same genotype, # p < .01; ## p < .01; ### p < .01; #### p < .001 indicate statistically significant differences between genotypes for sedentary and exercised animals, @@ p < 0.01; @@@@ p < 0.0001 indicate statistically significant differences pre‐ and post‐exhaustion