
Figure 3.
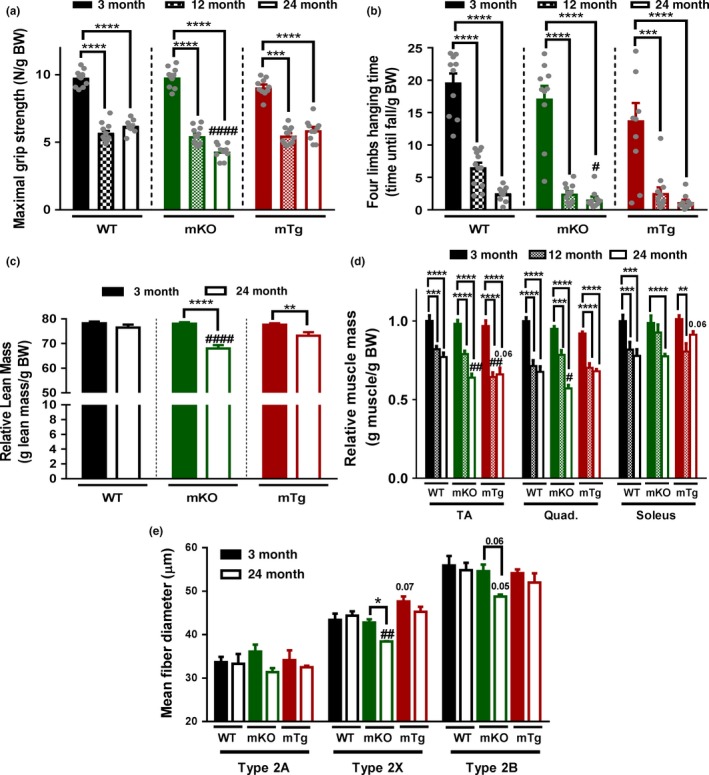
Absence of PGC‐1α accelerate sarcopenia (a) Maximal grip strength (n = 10–12). (b) Four limbs hanging time (n = 10–12). (c) Lean relative to body mass (n = 10). (d) Muscle mass relative to body weight (n = 5–6). (e) Tibialis anterior fiber type specific minimum ferret diameter (n = 3–4). Values are mean ± SEM. *p < .05; **p < .01; ***p < .001; ****p < .0001 indicate statistically significant differences between young and old animals of the same genotype. # p < .01; ## p < .01; #### p < 0.001 indicate statistically significant differences between genotypes of age‐matched animals