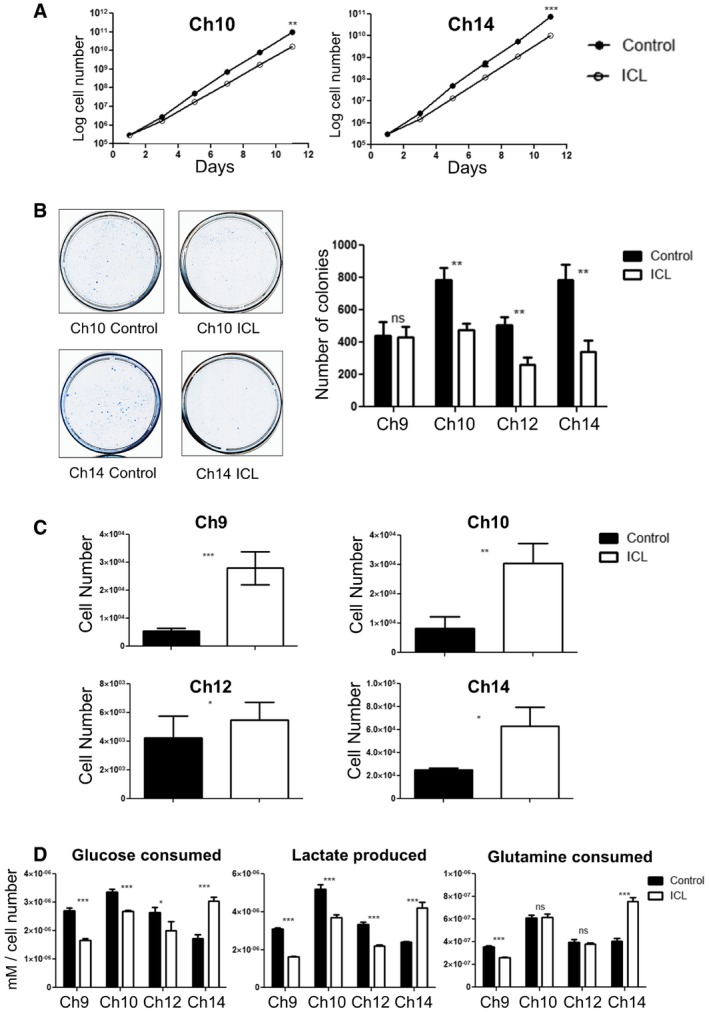
Figure 6. In vitro characterization of later passage ICL MEFs.

- Growth curve of the later passage ICL lines Ch10 and Ch14 under adherent in vitro culture conditions (n = 3 for each data set and error bars denote SD, **P < 0.005 for Ch10 and ***P < 0.0001 for Ch14). See also Appendix Fig S3A. Two‐tailed unpaired t‐test was used to determine statistical significance.
- Colony formation in ICL and control MEFs. 5,000 cells were seeded in 10‐cm plates and stained with methylene blue after 3 days. Representative colony formation images in Ch10 and Ch14 are shown (left) and quantification of colonies formed (right) in the 4 ICL lines (n = 3 for each data set and error bars denote SD, **P < 0.005 for Ch10, Ch12, and Ch14 and ns for Ch9). Two‐tailed unpaired t‐test was used to determine statistical significance.
- Quantification of growth in ultra‐low adherent, sphere‐forming conditions for the four ICL lines (n = 3 for Ch10 and Ch14, n = 6 for Ch9 and Ch12 and error bars denote SD, ***P < 0.0001 for Ch9, **P < 0.001 for Ch10 and *P < 0.05 for Ch12 and Ch14). Two‐tailed unpaired t‐test was used to determine statistical significance.
- Analysis of metabolites (glucose consumed, lactate produced and glutamine consumed) for the ICL lines. Spent media was analyzed after each ICL, and control line was grown in culture for 3 days. Media in identical culture conditions, but with no plated cells, was used as a baseline for all samples (n = 3 for each data set and error bars denote SD; Glucose consumed: ***P < 0.0005 for Ch9 and Ch14, ***P = 0.0005 for Ch10 and *P < 0.05 for Ch12; Lactate produced: ***P < 0.0005 for Ch9 and Ch12, ***P = 0.0008 for Ch10, and ***P = 0.0005 for Ch14; Glutamine consumed: ***P < 0.0005 for Ch9 and Ch14). Two‐tailed unpaired t‐test was used to determine statistical significance.
