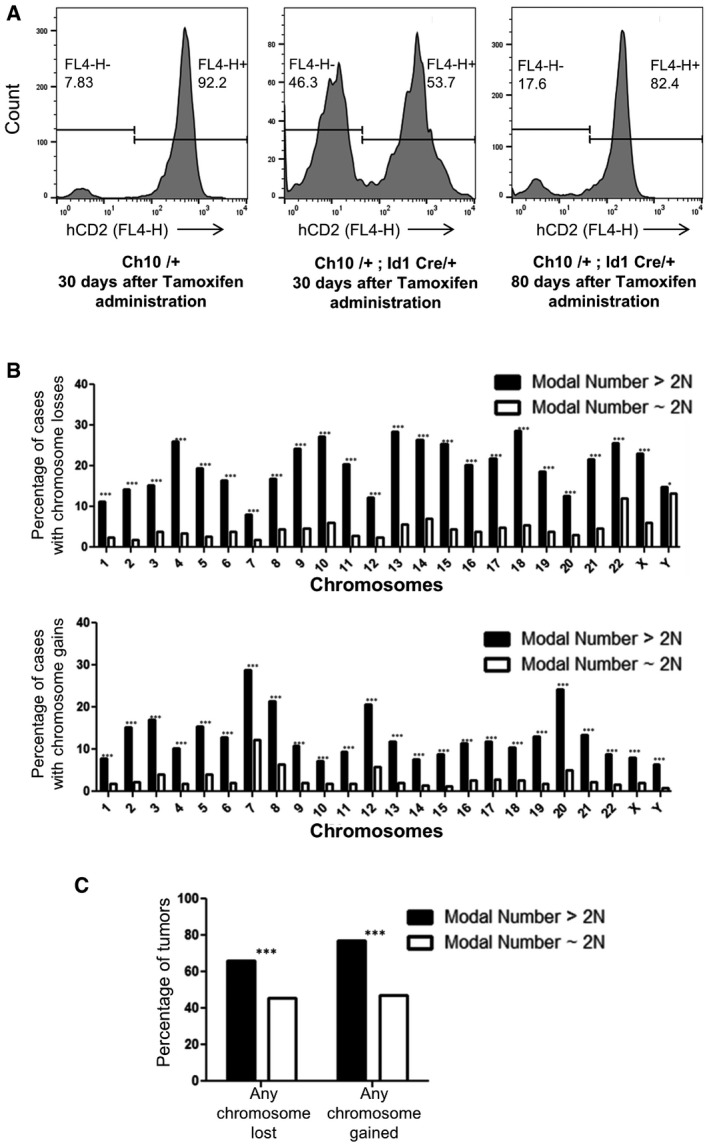
Figure 7. Effects of ploidy on the tumorigenic potential of ICL cells.

- Flow cytometry analysis of tail blood from Ch10/+ (control) at 30 days post‐tamoxifen administration, Ch10/+; Id1 Cre/+ at 30 days post‐tamoxifen administration, and Ch10/+; Id1Cre/+ at 80 days post‐tamoxifen administration.
- Analysis from the Mitelman database for the fraction of human solid tumors that have lost (top) or gained (bottom) individual chromosomes that have modal chromosome number > 2N or ˜2N (n = 3,459 cases for modal number > 2N and n = 12,464 cases for modal number ˜2N, top: ***P < 0.0001 for chromosomes 1–22, X and *P < 0.05 for chromosome Y; bottom: ***P < 0.0001 for all chromosomes). Two‐tailed two‐sample t‐test to compare sample means was used to determine statistical significance.
- Analysis from the Mitelman database for the fraction of human solid tumors that have lost or gained any chromosome that have modal chromosome number > 2N or ˜2N (n = 3,459 cases for modal number > 2N and n = 12,464 cases for modal number ˜2N, ***P < 0.0001 for both modal number > 2N and ˜2N). Two‐tailed two‐sample t‐test to compare sample means was used to determine statistical significance.
