
Figure 5.
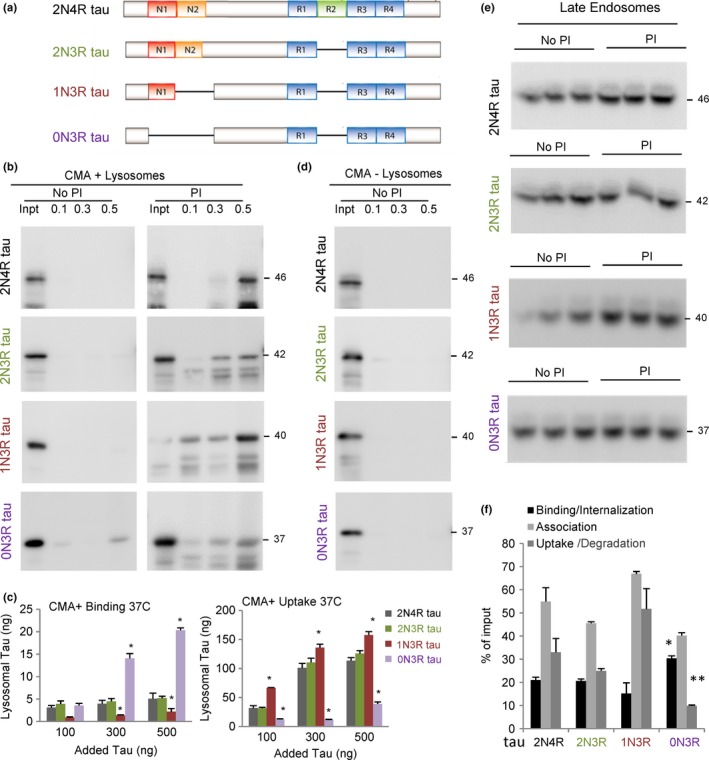
Degradation of different tau isoforms by selective autophagic pathways. (a) Scheme of the domain composition of the different tau isoforms analyzed in this study. (b) Immunoblots for tau of isolated CMA‐active lysosomes pretreated or not with protease inhibitors (PI) for 10 min at 4 °C and then incubated with the indicated concentrations (μg) of tau proteins at 37 °C for 20 min. Inpt: input. (c) Quantification of binding (left) and uptake (right) of tau proteins by the CMA‐active lysosomes. Values are indicated in ng, calculated from the densitometric quantification of a known amount of purified protein. n = 5. (d) Immunoblot of tau proteins incubated under the same condition as in b but with CMA‐inactive (−) lysosomes. (e) Immunoblots for tau in isolated late endosomes pretreated or not with protease inhibitors (PI) for 10 min at 4 °C and then incubated with the indicated tau proteins (0.5 μg) at 37 °C for 30 min. (f) Quantification of binding, association, and uptake/degradation of tau proteins by the late endosomes. Values are indicated as percentage of the input, calculated from the densitometric quantification of a known amount of purified protein. n = 4. All values are mean ± SEM. Differences with hTau40 WT were significant for *P < 0.05 and **P < 0.001.