
Fig. 2.
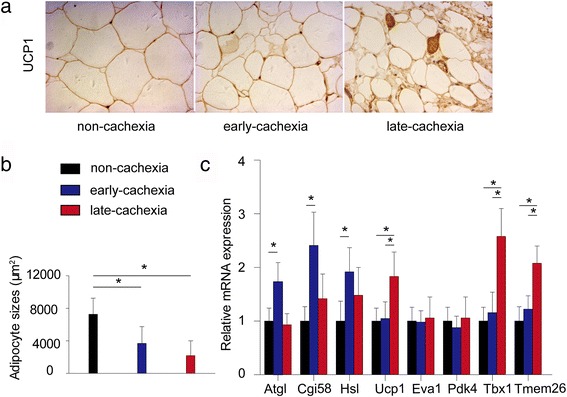
Comparisons of subcutaneous WAT among patients with non-cachexia (n = 50), patients with early-stage cachexia (n = 40), and patients with late-stage cachexia (n = 28). a Representative Ucp1 staining of subcutaneous WAT in different groups of patients. b Mean sizes of adipocyte in different groups of patients. c mRNA expression of WAT lipolysis and browning associated genes in different groups of patients. *P < 0.05