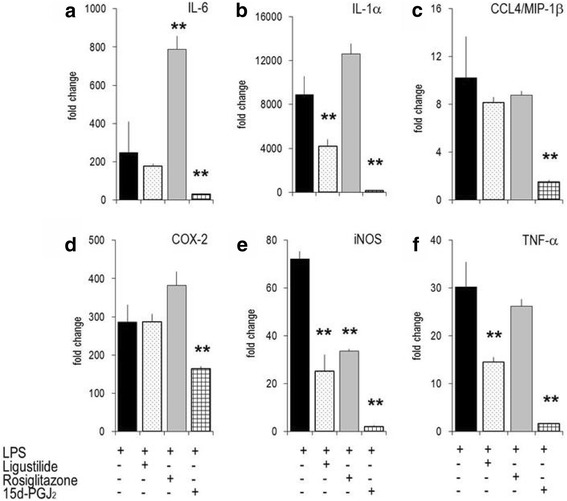
Fig. 6.

Modulation of gene expression by z-ligustilide, rosiglitazone and 15d–PGJ2 in RAW 264.7 cells. Unstimulated or LPS-stimulated RAW264.7 cells were cultured for 4 h in the presence of graded amounts of LIG (25 μM), rosiglitazone (25 μM) or 15d–PGJ2 (2.5 μM). mRNA levels were determined by RT-PCR. Bars represent mean values of fold change +/− errors of triplicates (versus unstimulated cells; set at 1). ** p-value <0.01 (versus ‘LPS-alone’ stimulated cells). a: IL-6; b: IL-1α; c: CCL4/MIP-1β; d: COX-2; e: iNOS; f: TNF-α
