
Fig. 6.
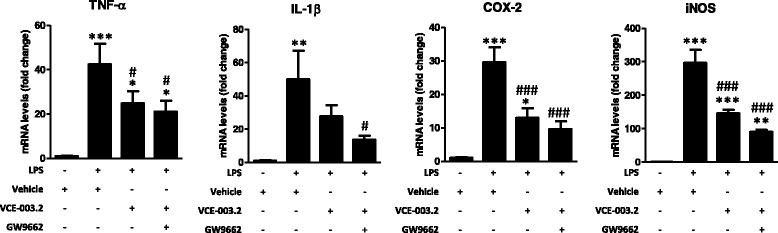
mRNA levels for TNF-α, IL-1β, COX-2, and iNOS measured in the cell pellets of cultured BV2 cells exposed to LPS (0.5 μg/ml) in the presence or absence of VCE-003.2 (5 μM) and/or GW9662 (10 μM). Values are means ± SEM of at least 7 independent experiments each performed in duplicate. Data were assessed by the one-way analysis of variance followed by the Student–Newman–Keuls test (*p < 0.05, **p < 0.01, ***p < 0.005 versus control cells (no treated with LPS); #p < 0.05, ###p < 0.005 versus cells treated with LPS)