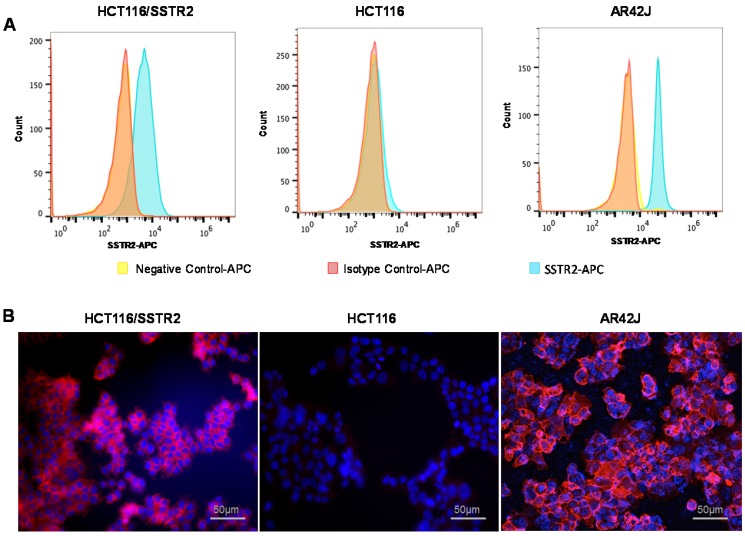
Figure 1.
Evaluation of SSTR2 expression levels by cell lines. (A) Representative histograms of SSTR2 expression evaluated by flow cytometry showing unstained cells (negative control), an isotype control antibody and anti-SSTR2 antibody of HCT116 (low levels), HCT116/SSTR2 (medium levels) and AR42J (high levels). (B) Representative immunofluorescence staining (X20) of Anti-SSTR2 (red) and nucleus (DAPI, blue).

