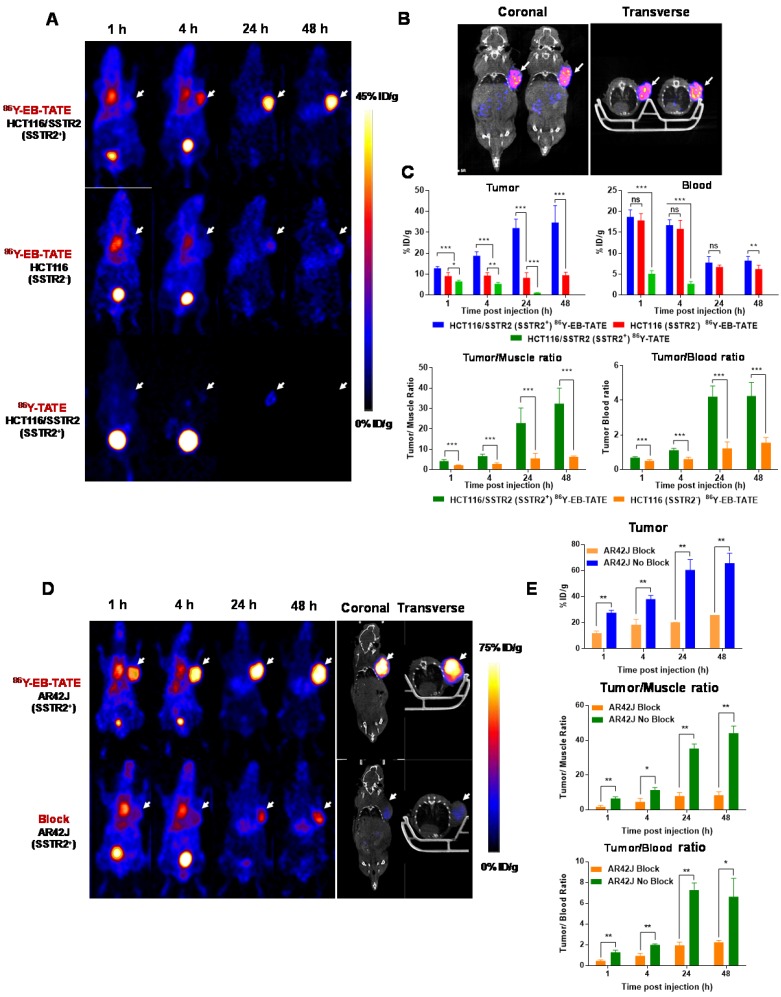
Figure 3.
In vivo distribution of EB-TATE. (A) Representative projection PET of HCT116/SSTR2 (SSTR2+) and HCT116 (SSTR2-) tumor models, injected with 86Y-EB-TATE or 86Y-TATE over time. (B) Co-registration of coronal PET/CT of HCT116/SSTR2 injected with 86Y-EB-TATE at 24 h p.i. White arrows indicate the tumor location. (C) Quantification of %ID/g of indicated tracer in tumor and blood (left) and tumor-to-muscle and tumor-to-blood ratios calculated from PET over time in HCT116/SSTR2 tumor model. (D) Representative projection PET (left) and PET/CT (right) of AR42J (SSTR2+) xenografts injected with 86Y-EB-TATE (upper panel) or 86Y-EB-TATE co-injected with unlabeled EB-TATE (>50 fold excess) for blocking. (E) Quantification of %ID/g of indicated tracer in tumor, and tumor-to-muscle and tumor-to-blood ratios calculated from PET over time in AR42J tumor model. White arrows indicate the tumor location. **P < 0.01, ***P < 0.001.

