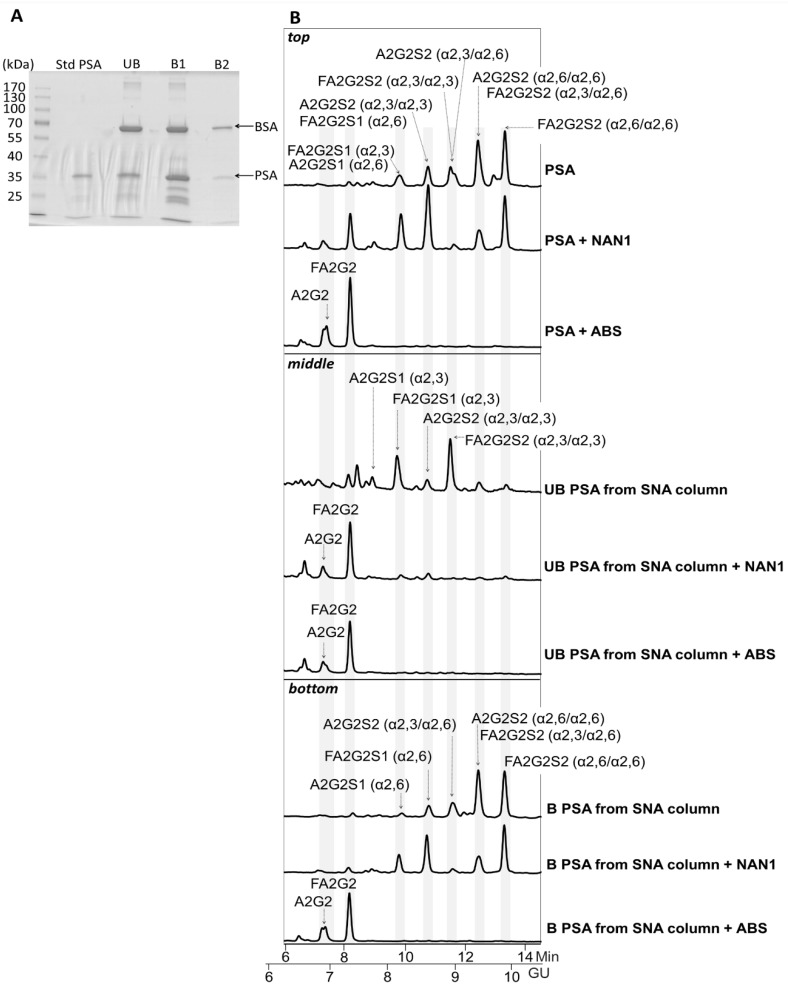
Figure 4.
Glycosylation analysis of Std PSA fractionated with SNA chromatography. (A) Coomassie staining of a 10% SDS-PAGE gel containing the molecular weight marker (Mw), Std PSA and the unbound (UB), bound (B) B1, and B2 elution fractions from the SNA column. PSA is indicated with an arrow. Bovine Serum Albumin (BSA) bands arise from the elution buffer (see Materials and Methods for details). (B) HILIC-UPLC chromatograms of N-glycans released from the Std PSA (top panel), UB fraction (middle panel) and B fraction (bottom panel). N-glycan profiles after sialidase digestions with NAN1 (specific for α2,3-sialic acid) and ABS (digests all sialic acids) are depicted under undigested chromatograms. Profiles are standardized against a dextran hydrolysate (GU). N-glycans structures are abbreviated as indicated in Figure 1 legend.

