Figure 4.
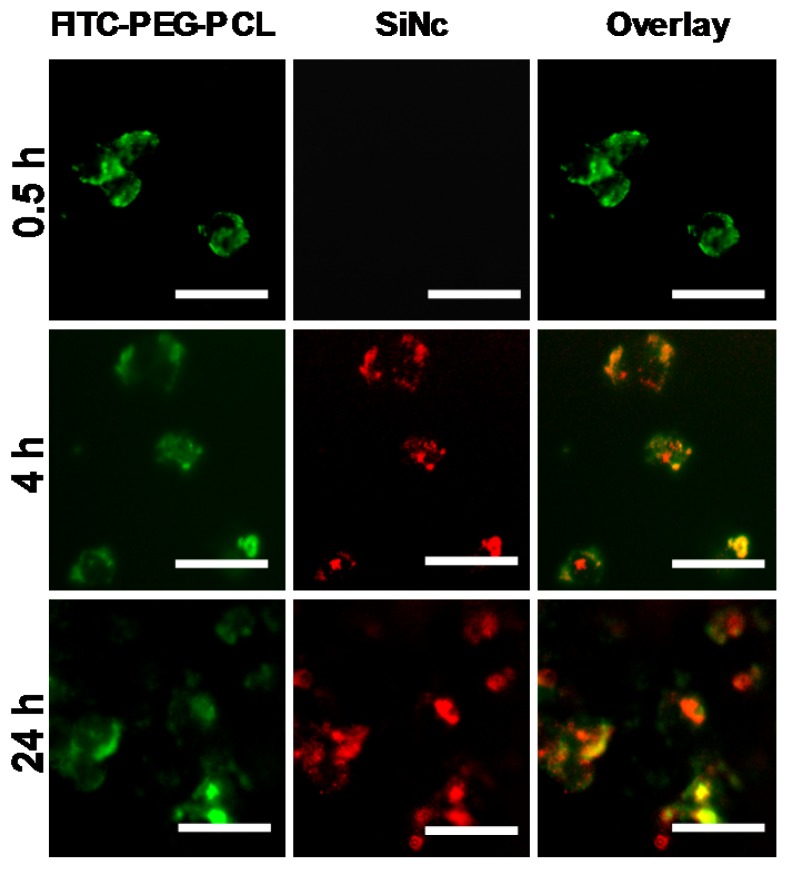
Representative fluorescence microscopy images of A2780/CDDP ovarian cancer cells at different incubation periods (0.5, 4, and 24 h) with activatable SiNc-PNP prepared with FITC-labelled PEG-PCL. The left panel shows images of A2780/CDDP ovarian cancer cells obtained at Ex. 470/Em. 510 nm, representing fluorescence signals from FITC-PEG-PCL; the middle panel show images obtained at Ex. 710/Em. 775 nm, representing NIR fluorescence signals from SiNc; the right panel is an overlay of the first two panels. All images were acquired using a 40 × objective; scale bar is 50 µm for all images.

