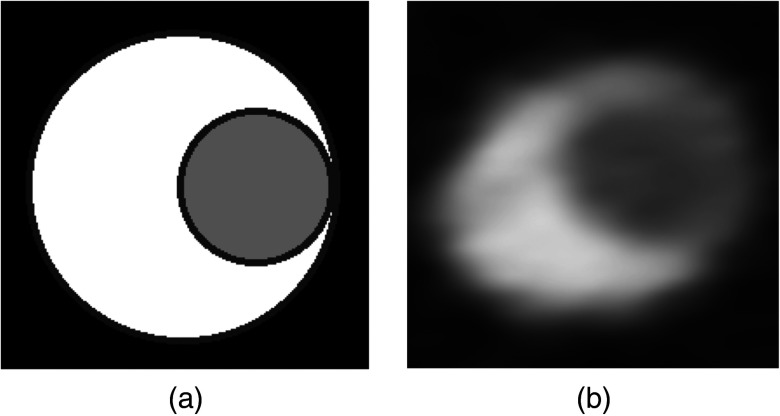
Fig. 3.
(a) Axial cross section of virtual plaque model at maximum stenosis (WW: 1000, WL: 300). Black represents epicardial fat, gray represents enhanced lumen, and white represents calcified plaque. (b) CTA image of 3D-printed model at maximum stenosis. Black is canola oil (), gray is elemental iodine concentration of (200 HU), and white is dental resin mixture composed of 40% amorphous calcium phosphate (500 HU).

