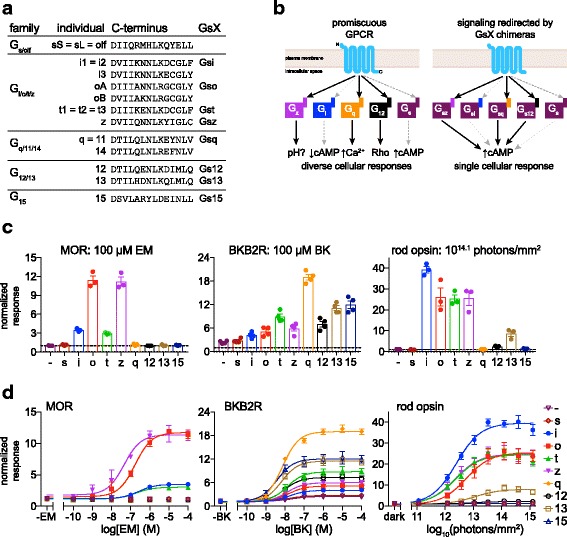
Fig. 1.

Profiling GPCR and opsin G-protein selectivity using the GsX assay. a C-terminal 14 amino acids of all human Gα subunits, grouped by family. Gα subunits with identical C-terminal sequences (e.g., Gq and G11) are represented with a single entry. The eight GsX chimeras used in this study are indicated at right. All GsX chimeras consist of wild-type GsS with the 13 amino acids after the final conserved aspartate replaced by the C-terminal 13 amino acids of the donor Gα subunits. In Gsi, Gso, and Gst chimeras, the -4 cysteine is replaced by serine (not shown) for insensitivity to pertussis toxin. GsX chimeras representing Gi3, GoB, and G14 were not tested. b Promiscuous GPCRs couple to multiple Gα subunits and activate different cellular responses. In this case, a hypothetical GPCR activates Gz, Gq, and G12 (black arrows), but not Gi or Gs (dashed gray arrows). In the GsX assay, this GPCR produces an increase in cAMP when co-transfected with Gsz, Gsq, or Gs12, but not Gsi or wild-type Gs. c,d HEK293T cells treated with pertussis toxin and transfected with Glo22F cAMP reporter and mu-opioid receptor (MOR), bradykinin receptor B2 (BKB2R), or rod opsin, without exogenous Gα (-), + wild-type Gs (s), or + GsX were stimulated with endomorphin-1 (EM), bradykinin (BK), or 470 nm light. GloSensor cAMP luminescence for each trial was normalized to pre-stimulus baseline, and the maximum cAMP fold-change post-stimulus (normalized response) within 20 mins for BKB2R and MOR, or 10 mins for rod opsin, was recorded. Replicate responses to saturating stimuli are shown in (c), with mean and SEM (n = 4, BK; n = 3, MOR, RHO). Stimulus–response curves (d) show average cAMP response +/- SEM. Fits show sigmoidal dose–response curves of the form y = a + b/1 + 10(c - x) where a is bottom, b is top-bottom, and c is logEC50. LogEC50 and top-bottom (response amplitude) values for each GPCR/GsX combination are listed in Additional file 1. BKB2R and MOR data have been additionally normalized to account for systematic variation in response amplitude between replicates. For details of data processing, see “Methods.” BK bradykinin, BKB2R bradykinin receptor B2, EM endomorphin-1, Glo22F GloSensor 22 F, GPCR G-protein-coupled receptor, MOR mu-opioid receptor, RHO human rod opsin, SEM standard error of the mean
