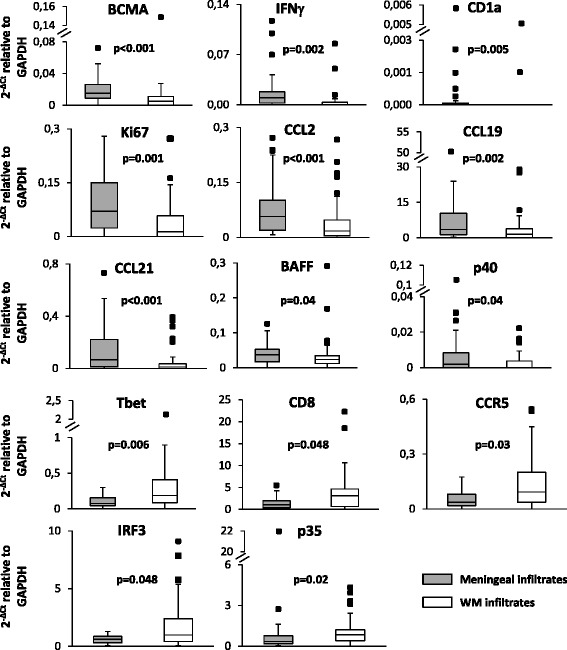
Fig. 3.

Differential expression of immune-related genes between immune infiltrates isolated from the meninges and the WM. Data obtained in 36 meningeal infiltrates and 39 WM perivascular infiltrates were compared using the Mann–Whitney test; both statistically significant differences (p < 0.01, to account for multiple comparisons) and trends (p ≥ 0.01, < 0.05) are shown. Gene expression values are presented as 2−ΔCt relative to GAPDH. The lines inside the boxes represent the median value; boxes extend from the 25th to the 75th percentile, covering the interquartile range (IQR), and whiskers extend from 25th percentile − 1.5 IQR to the 75th percentile + 1.5 IQR. Maximum outliers outside the whiskers are represented by individual marks
