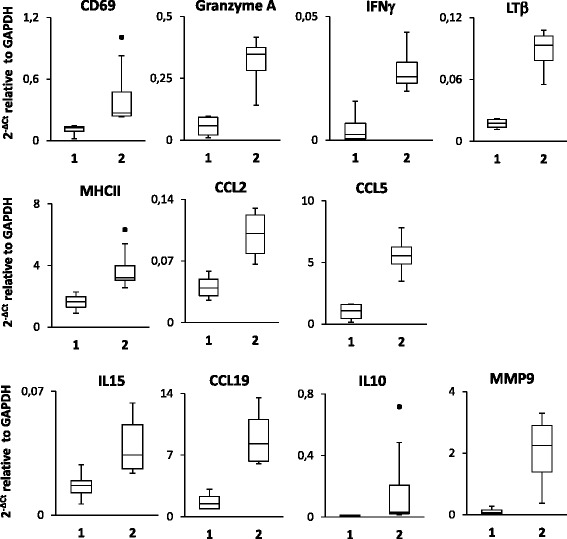
Fig. 7.

Genes expressed in meningeal infiltrates with discriminatory power in cluster analysis. Expression values of the indicated genes in meningeal immune infiltrates from MS cases grouped into cluster 1 (n = 4) and cluster 2 (n = 4) are expressed as 2−ΔCt relative to GAPDH. Significant differences between the two groups were assessed by Mann–Whitney test (p values = 0.02). The lines inside the boxes represent the median value; boxes extend from the 25th to the 75th percentile, covering the interquartile range (IQR), and whiskers extend from 25th percentile − 1.5 IQR to the 75th percentile + 1.5 IQR. Maximum outliers outside the whiskers are represented by individual marks
