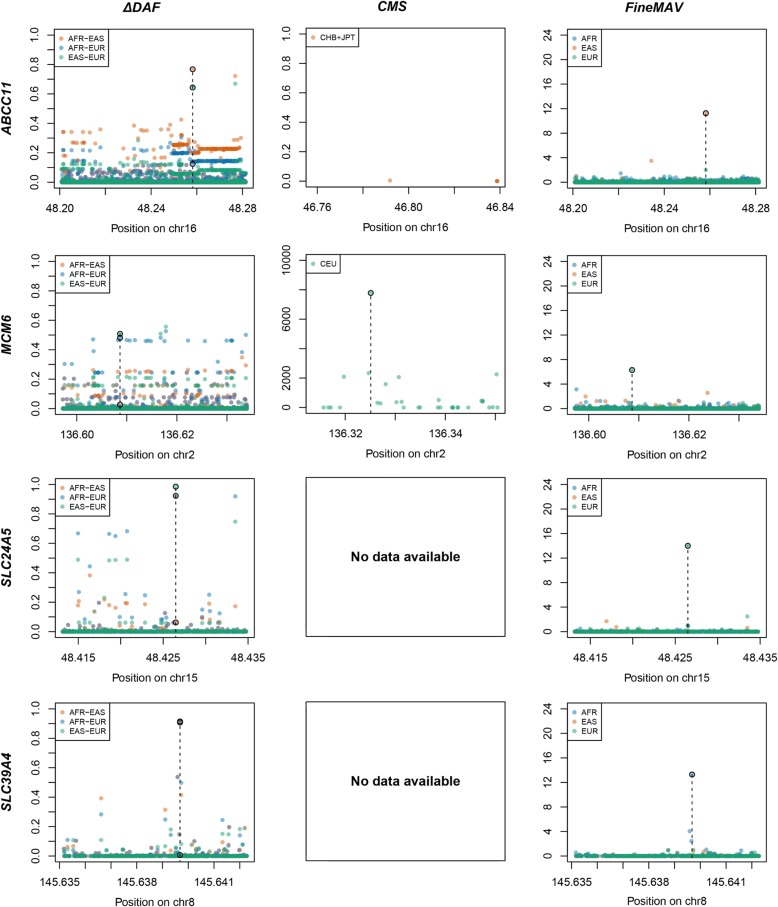
Fig. 2.
Comparison of FineMAV with existing approaches for pinpointing positively selected variants in the calibration set. ΔDAF, CMS, and FineMAV scores are shown for the genomic windows spanning genes from the gold standard calibration panel. ΔDAF and FineMAV were calculated from the 1000 Genomes Project Phase3 dataset [37] for Africans (AFR, blue), East Asians (EAS, orange), and Europeans (EUR, green). CMS scores for localized regions were downloaded from an online repository [39] and included: region8new and region152new calculated using the pilot phase of 1000 Genomes Project [129]. Variants with CMS value set to “nan” were not plotted; thus, some CMS plots are missing. Genomic positions are given in Mb according to GRCh37 for ΔDAF and FineMAV, and build NCBI36 for CMS. The selected variant is marked with a dashed line. FineMAV notably reduced the noise of neutral background variation, so that the selected variant is always the highest scoring one in any given gene. Note that the y-axis scale in the CMS plots is not standardized

