Fig. 2.

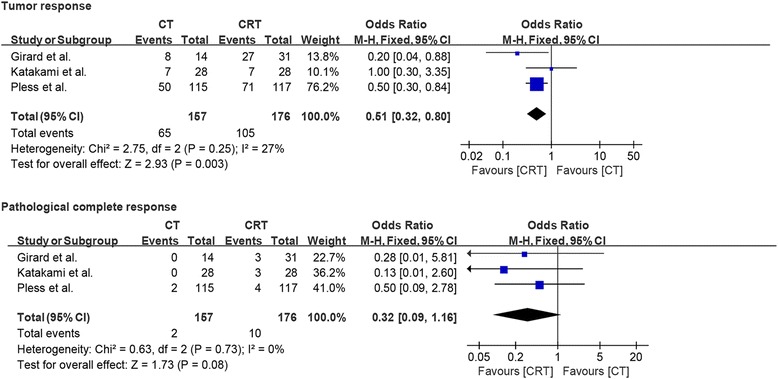
Forest plots comparing tumor response and pathological complete response in patients who received induction chemotherapy or induction chemoradiotherapy

Forest plots comparing tumor response and pathological complete response in patients who received induction chemotherapy or induction chemoradiotherapy