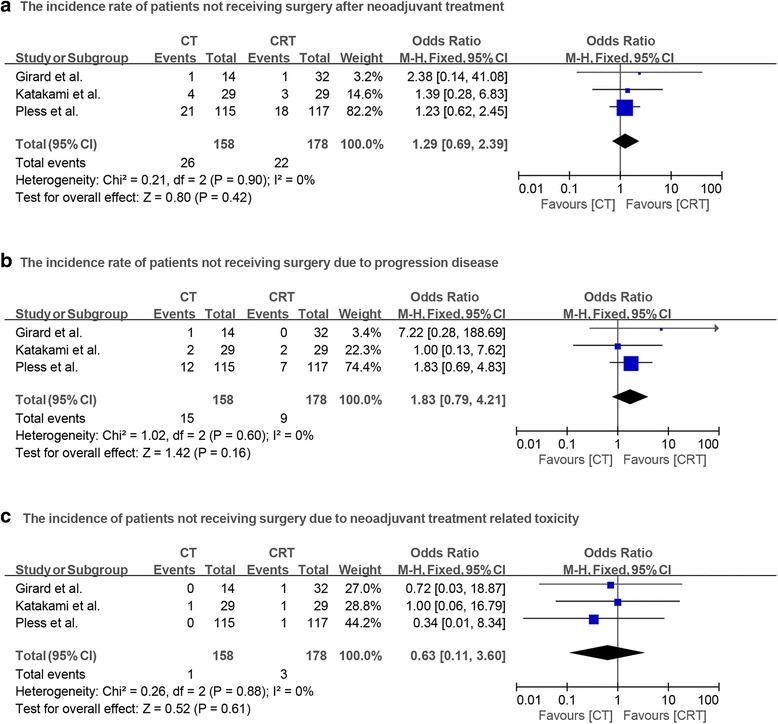
Fig. 4.

a Forest plot comparing the incidence of patients who did not have surgery after neoadjuvant therapy in chemotherapy and chemoradiotherapy groups. b Forest plot comparing the incidence of patients not receiving surgery due to progression disease in two groups. c Forest plot comparing the incidence of patients not receiving surgery due to neoadjuvant therapy related toxicity in two groups
