
Fig. 3.
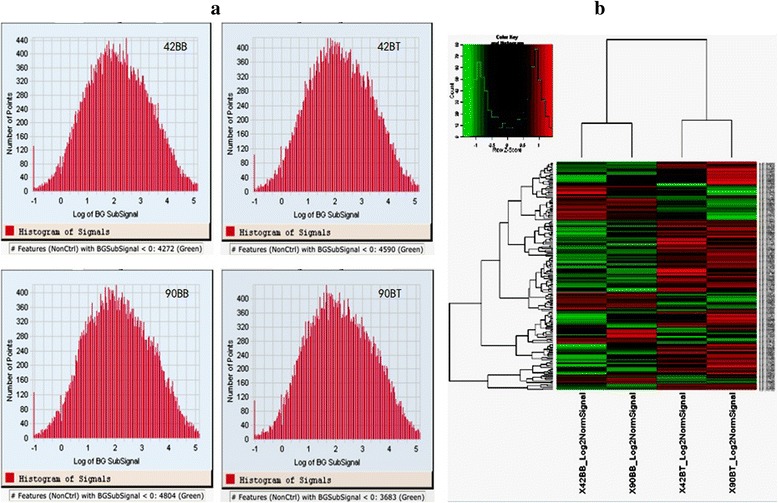
Validation of data in the microarray. a the normal distribution test. In each microarray, data was in accordance with normal distribution; b cluster analysis of all microarrays. The results showed that the data in the microarrays of chickens at 42 d and 90 d within the same tissue were closely related