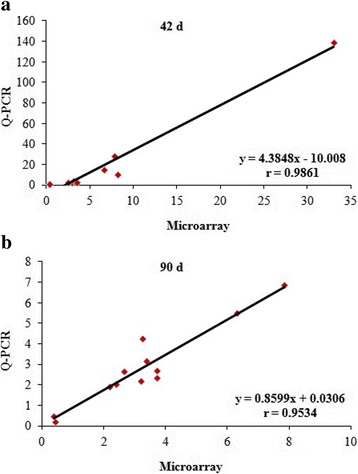
Fig. 5.

Technical validation of microarray results using q-PCR correlation. a and b. The r = 0.9861 (42 d, P < 0.01) (a) and r = 0.9534 (90 d, P < 0.01) (b) indicate that the Spearman Rank Correlation between breast and thigh were positive. This indicated that the q-PCR fold changes were in complete correspondence with the microarray data in two days of age. Data are the means ± SD, n = 12
