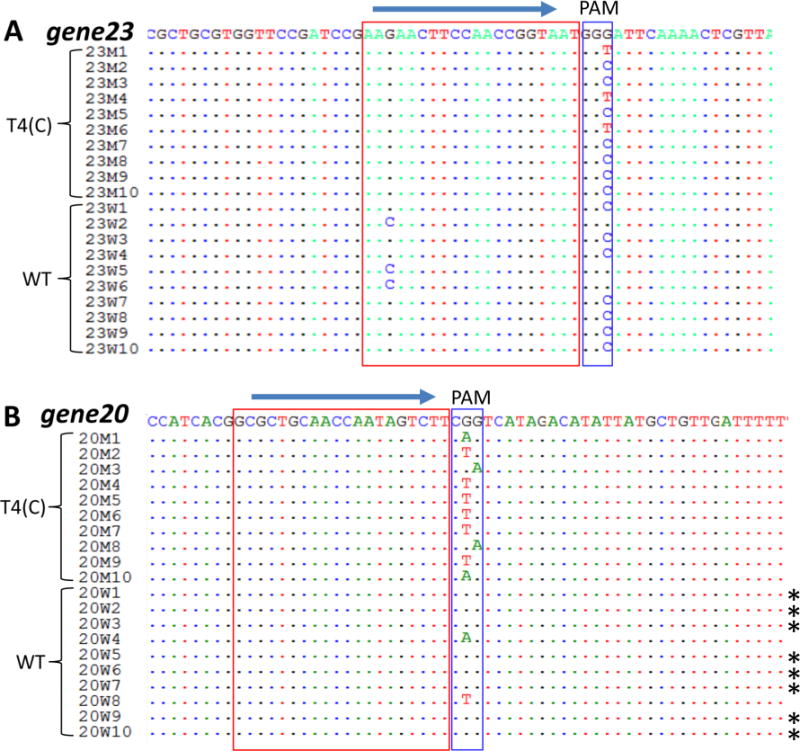
Figure 3.

Alignment of CRISPR-Cas escape mutant sequences. The WT and T4(C) mutant phage infections were carried out as per the basic scheme shown in Figure 1. Single plaques that appeared on E. coli containing spacer 23–2 (g23) (A) or 20–995 (g20) (B) were isolated and the DNA flanking the protospacer and PAM sequences was amplified by PCR and sequenced. The blue arrows show the 5′ to 3′ direction of the spacer sequences. The spacer sequences are marked with red boxes and the PAM sequences are marked with blue boxes. The asterisks (∗) indicate the WT sequences.
