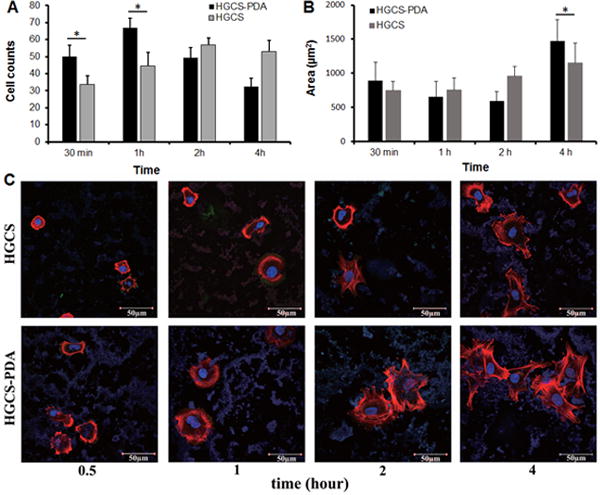
Figure 4.

Number of rMSCs on HGCS-PDA and HGCS coated coverslips was counted as cell number after 0.5, 1, 2 and 4 hours, respectively (A) and the cellular area was measured as the area/cell using Image J (B). Images were taken by selecting ten random areas and data were represented as Average ± Deviation (n=3, *p< 0.05). Immuno-fluorescent images of cytoskeletal actin (red), vinculin (green) and nucleus (blue) for rMSCs were acquired using confocal microscope (C).
