
Fig. 4.
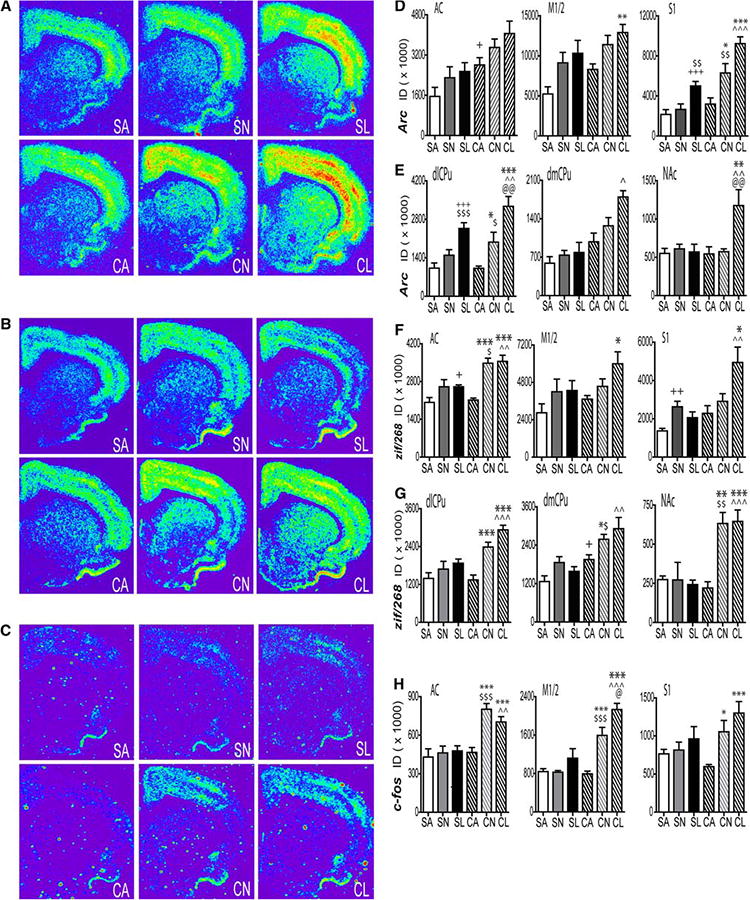
IEG expression at the end of a 1 h extinction test, 15 days after the last cocaine or yoked-saline administration. Representative coronal hemi-sections illustrating the expression pattern of (a) arc, (b) zif/268, and (c) c-fos hybridization signals. Quantitative analysis of the integrated density of the hybridization signal for (d) arc (f) zif/268 and (h) c-fos, mRNA in the rat AC (d, f, h, left), M1/2 (d, f, h, middle), and S1 (d, f, h, right) cortices or in the dlCPu (e, g, left), dmCPu (e, g, middle), and NAc core (e, g, right). N = 4–5 per group. *P<0.05,**P < 0.01, ***P<0.001 versus CA, @@P<0.01, @@@P<0.0001 versus CN, +P<0.05, +++P<0.001 versus SA, ^P<0.05,^̂P<0.01, ^̂̂P < 0.001 versus SL, $P < 0.05, $$$P < 0.001 versus SN. ID integrated density, SA saline alternate environment, SL saline lever available, SN saline no lever, CA cocaine alternate environment, CN cocaine no lever, CL cocaine lever available