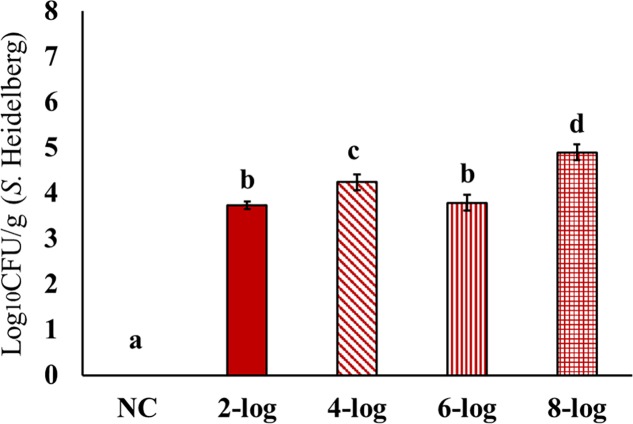
FIGURE 1.
Effect of different inoculum levels on MDR S. Heidelberg colonization in the ceca of poults (Means ± SE; NC, 2-log, 4-log, 6-log, and 8-log treatments had a total of 20, 20, 18, 19, and 20 cecum samples/group, respectively, for the final analysis. a-d Bars with different superscripts differ significantly from each other at P < 0.05). NC, Negative Control.

