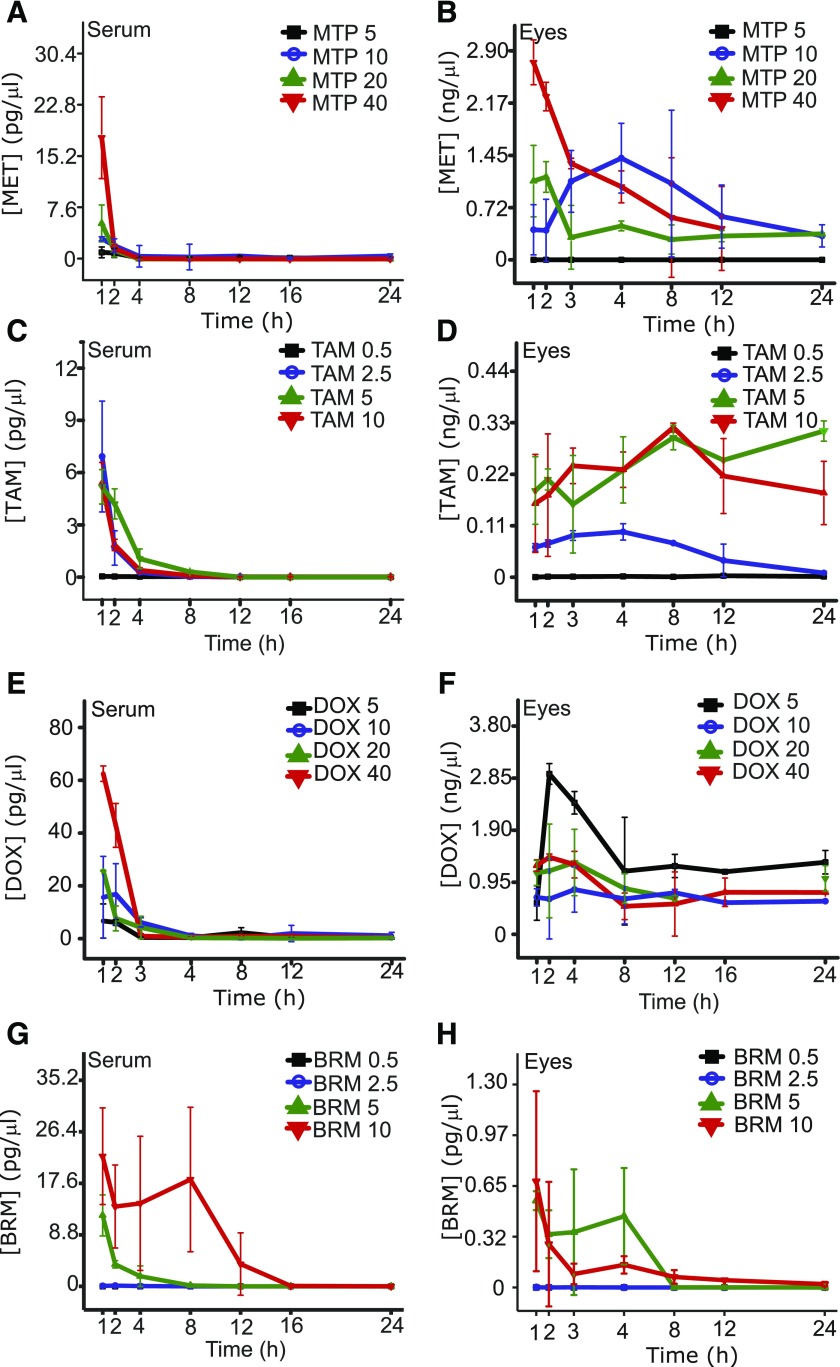
Fig. 5.
Serum and eye levels of MTP, TAM, DOX, and BRM after single intraperitoneal injections. (A and B) Serum and eye levels of MTP. Levels corresponding to the 5, 10, 20, and 40 mg/kg doses are shown. (C and D) Serum and eye levels of TAM. Levels of the drug in the serum and eye corresponding to the 0.5, 2.5, 5, and 10 mg/kg doses are shown. (E and F) Serum and eye levels of DOX. Levels of DOX corresponding to 5, 10, 20, and 40 mg/kg doses are shown. (G and H) Serum and eye levels of BRM. Levels of BRM corresponding to 0.5, 2.5, 5, and 10 mg/kg doses are shown.

