Figure 5.

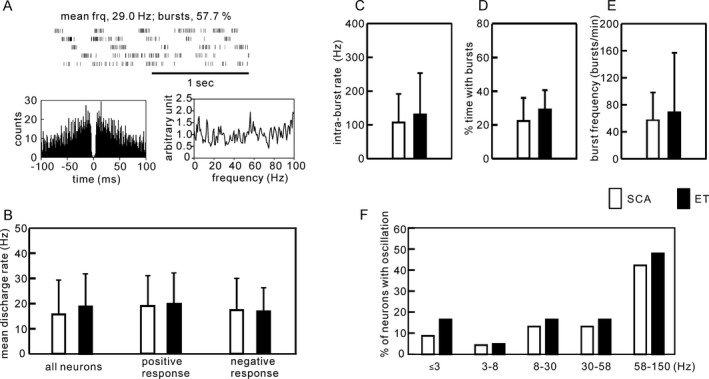
Comparison of the patterns of Vim neuronal discharges. Sixty‐eight Vim neurons in five SCA patients and 60 Vim neurons in five ET patients recorded under resting condition were analyzed. (A) An example of Vim neuronal discharges and the corresponding autocorrelogram and PSD. (B) The mean discharge rate of all neurons identified in Vim, neurons with positive sensory responses and neurons with negative sensory responses were not significantly different between SCA and ET. (C,D,E) The features of the bursting were not significantly different between groups. (F) The PSD analysis failed to reveal significant between‐group differences in any of the frequency bands analyzed. Bars represent means and SDs.
