Figure 1.

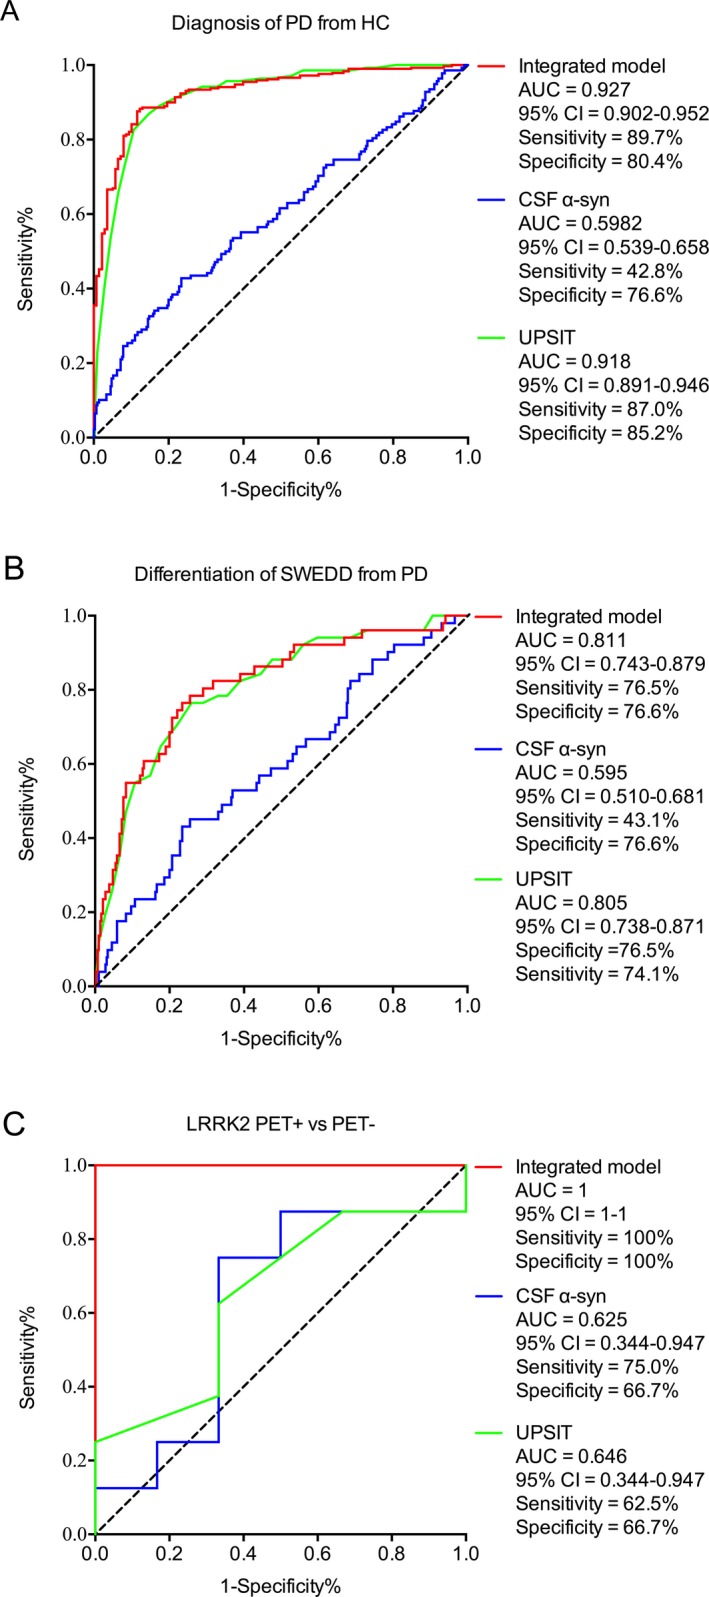
Figure 1 A. Receiver operating characteristic curves for the integrated model (red line), ?‐syn (blue line) and UPSIT (green line) to discriminate PD from HC in PPMI cohort. B. Receiver operating characteristic curve for the integrated model (red line), α‐syn (blue line) and UPSIT (green line) to differentiate SWEDD from PD. C. Receiver operating characteristic curves for the integrated model (red line), α‐syn (blue line) and UPSIT (green line) to discriminate PET+ from PET‐ subjects in LRRK2 mutation cohort. Integrated model included α‐syn, UPSIT score, age and sex. AUC = area under curve.
