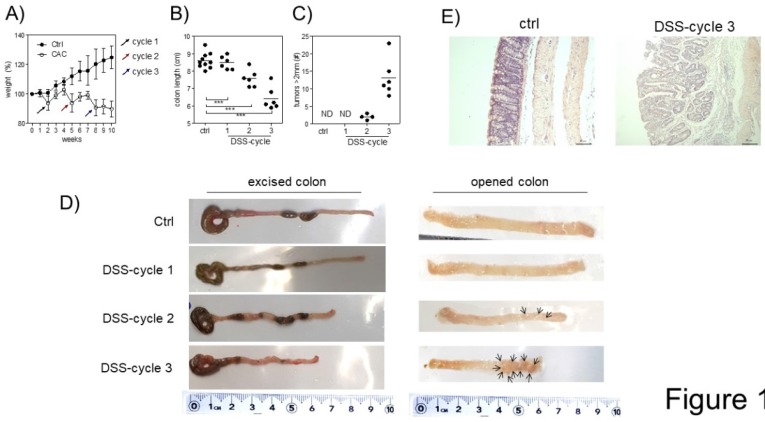
Fig 1.
Induction of CRC in Foxp3EGFP mice. A) Percentage of weight loss. The mean weight of mice on day 0 of treatment was taken as 100% and was compared with the weekly weight until the end of the experiment. B) Length and C) number of tumors in the colon 73 days after AOM injection. D) Macroscopic images of the colon length and number of tumors 73 days after AOM injection (arrows are pointing the tumors). E) Hematoxylin and eosin staining of the colon to investigate the morphology of healthy and CAC-induced mice 73 days after AOM injection. Total data (A, B, C) and representative (D and E) of 2 different experiments with at least 3 mice per group per day of the analysis. * p ≤ 0.05, ** p ≤ 0.01, *** p ≤ 0.001; one-way ANOVA and Tukey's multiple comparison test.

