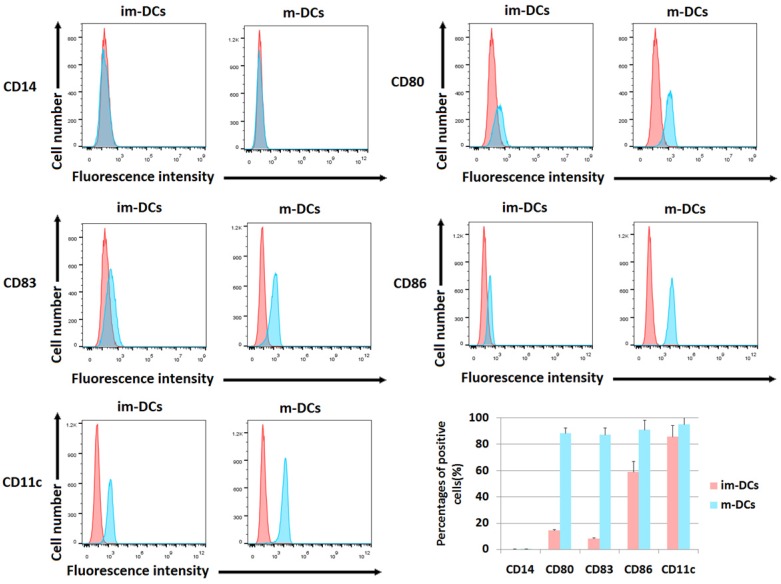
Figure 2.
Surface phenotype analysis of DCs. Cells were harvested and processed for staining with the antibody, as indicated. The staining of markers is shown, and the percentage of positive cells is stated (*p<0.05, **p<0.005, ***p<0.0005, ****p<0.00005). The phenotypic analyses of mature DCs on day 8 were compared with immature DCs on day 4. The biomarkers included CD14, CD80, CD83, CD86, and CD11c. The red peak represents the isotype group. The barplot showed the percentage of cells expressing each biomarker. The proportion of positive cells was calculated on Y-axis.

