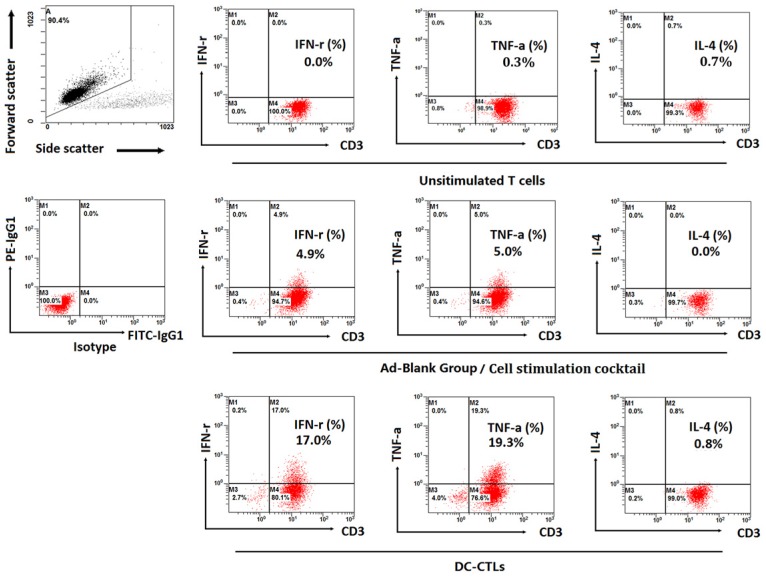
Figure 3.
Detection of intracellular IFN-γ, TNF-α, IL-4 and IFN-γ concentrations in the supernatant. Dot plots show the proportion of T cells expressing IFN-γ, TNF-α, and IL-4. The top left plot represents the gating strategy. The bottom left plot represents the isotype group. The 2nd to 4th plots on the top represent unstimulated T cells, the 2nd to 4th plots in the middle represent the Ad-Blank group (the recombinant non-proliferative adenovirus without any expression cassettes of tumor-associated antigens) stimulated with the cell stimulation cocktail, and the 2nd to 4th plots on the bottom represent the production of cytokines by DC-induced antigen-specific CTL cells.

