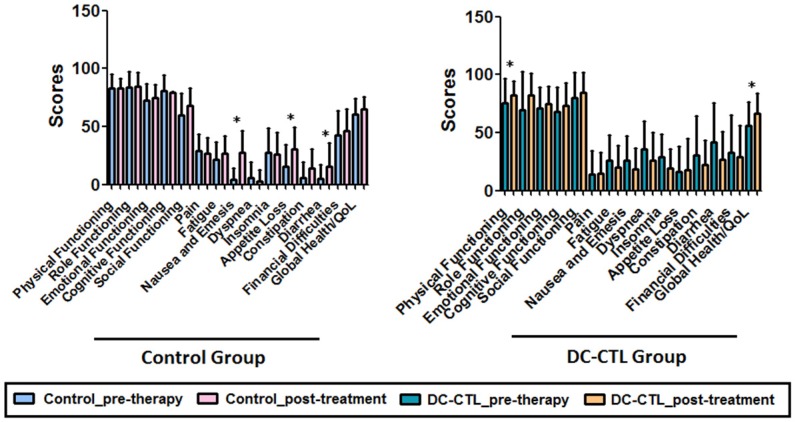
Figure 4.
Change in quality of life. The bar plot describes various scales for all the tumor patients measured at two visit times. The black bar represents the pre-immunotherapy visit, and the white bar indicates the last follow-up time after DC-CTL treatment. The X-axis represents the key scales of QLQ-C30, including, physical functioning (PF), role functioning (RF), emotional functioning (EF), cognitive functioning (CF), social functioning (SF), pain (PA), fatigue (FA), nausea and emesis (NV), dyspnea (DY), insomnia (SL), appetite loss (AP), constipation (CO), diarrhea (DI), financial difficulties (FD), and quality of life (QoL). The scale score was calculated and indicated on Y-axis. *Statistically significant differences (*p<=0.05, **p<=0.005)

