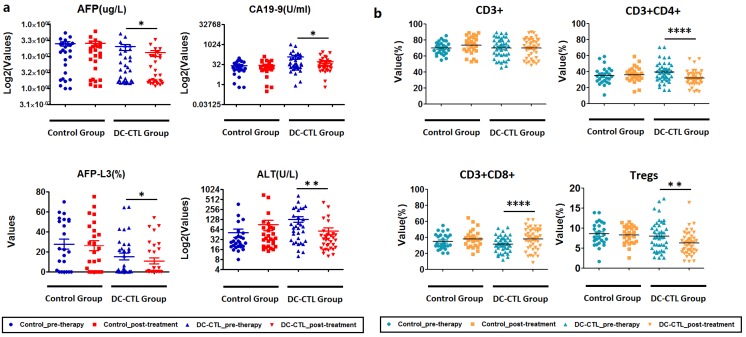
Figure 5.
Change in clinical and immune indicators a. The boxplot describes various clinical indicators for all patients, before and after DC-CTL treatment. The X-axis represents crucial clinical indicators, including ALT, AFP, CA19-9, and the percentage of alpha-fetoprotein L3 (AFP-L3(%)). These values were calculated and indicated on the Y-axis (*p<0.05, **p<0.005). b. Changes in immune indicators, including CD3+, CD3+CD4+, CD3+CD8+, and Tregs, before and after DC-CTL treatment compared with patients in the control group (*p<0.05, **p<0.005, ***p<0.0005).

