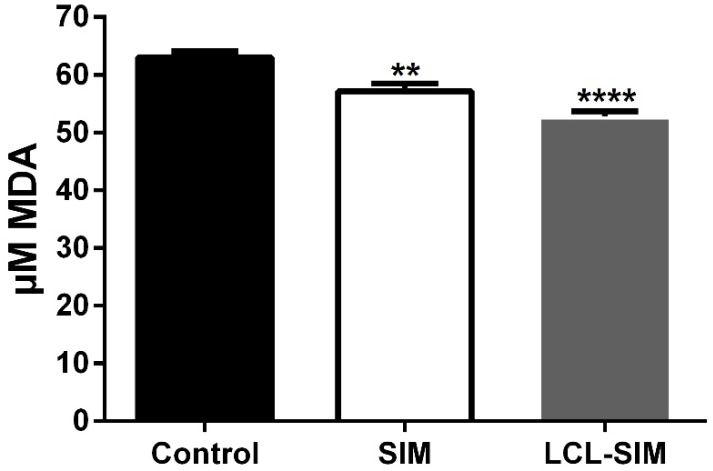
Figure 5.
The effect of LCL-SIM treatment on the MDA levels in C26 colon carcinoma. The results are expressed as mean ± SD of three independent measurements and compared with control tumors levels of MDA; Control - untreated group (group treated with PBS); SIM - group treated with 5 mg/kg free SIM at days 8 and 11 after tumor cell inoculation; LCL-SIM 5 mg/kg - group treated with 5 mg/kg LCL-SIM at days 8 and 11 after tumor cell inoculation; To compare the effects of each treatment on the tumor levels of the MDA with its control levels, one-way ANOVA with Dunnett's Test for multiple comparisons was used and the P values are indicated as follows:** (p<0.01), **** (p<0.0001).

