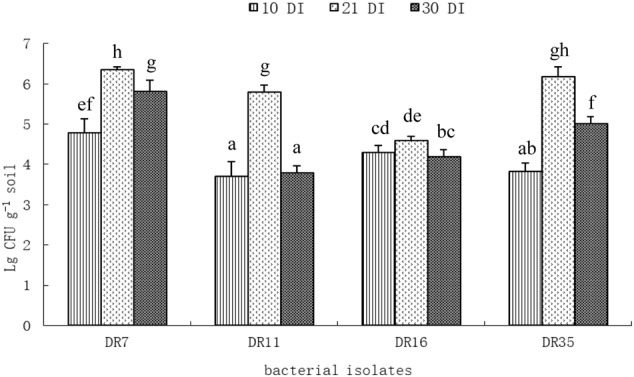
FIGURE 4.

Population density of different bacteria inoculated to foxtail millet at different time intervals under axenic conditions. 10 DI, 10 days after inoculation; 21 DI, 21 days after inoculation; 30 DI, 30 days after inoculation (9 days after water stress). Values with different letters are significantly different according to Duncan’s multiple range test (P = 0.05). Error bars show standard deviations of mean values.
