
Figure 3.
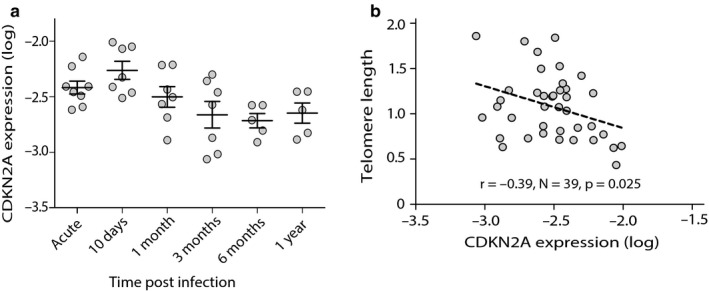
Relationship between telomere length and telomerase expression in blood of subset of travelers with RNA samples (n = 8, observations = 39) followed over one year after a successfully treated Plasmodium falciparum malaria infection. (a) Dynamics of CDKN2A level (log) after single acute malaria infection in peripheral blood; each gray circle represents the CDKN2A expression of individual sample, solid black lines represent the mean at each sampling point, and error bars denote the ± SE. (b) Pearson correlation (adjusted for cluster‐robust standard errors) between CDKN2A and telomere length