Figure 1.

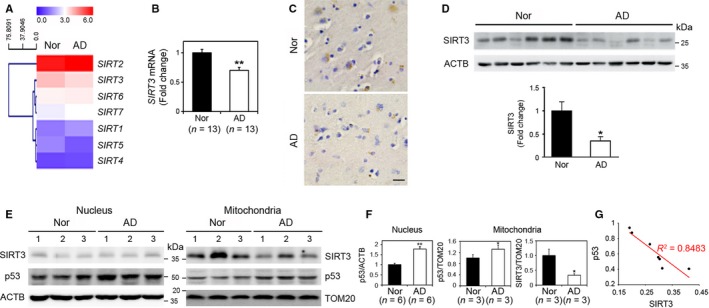
Levels of SIRT3 mRNA and protein are altered in AD. (A) A heat map showing that basal levels of SIRT gene expression are differentially regulated in AD cerebral cortex compared to normal subjects (Nor). Changes in gene expressions are the average of six samples from each group and displayed as higher (red) or lower (purple) color bars. (B) qRT–PCR analysis verified that SIRT3 mRNA is decreased in AD cortex (n = 13) compared to normal subjects (n = 13). GAPDH was used for normalizing SIRT3 expression. The bar graph data represents the mean ± SEM (*P < 0.05). (C) SIRT3 immunoreactivity was decreased in AD frontal cortex. Scale bar: 30 μm. (D) Western blot analysis showed that SIRT3 protein levels are decreased in AD (n = 6) compared to controls (n = 6). Actin was used as the loading control. Densitometry analysis of SIRT3 protein represented that SIRT3 protein was significantly decreased in AD (*P < 0.05). (E) Western blot analysis shows that levels of p53 were increased in nuclear and mitochondrial fractions of AD compared to normal subjects, whereas levels of SIRT3 protein were decreased in the mitochondrial fractions in patients with AD. ACTB and TOM20 were used as loading controls of the protein. (F) Densitometry analysis showed a significantly decreased SIRT3 but increased p53 protein levels in patients with AD. The bar graph data represent the mean ± SEM (*P < 0.05). (G) The regression analysis showed an inverse correlation between SIRT3 and p53 in the mitochondria fractions of patients with AD (n = 7, R2=0.8438, *P < 0.05).
